CONTRACT NO.
HY/2012/07
Tuen Mun �V Chek Lap Kok Link (Southern
Connection Viaduct Section)
Impact Monitoring
Report for Underwater Noise and Dolphin Acoustic Behavioural Monitoring
Prepared
by
TABLE OF CONTENT
1.
INTRODUCTION
2.1.
Overall Objective and Scheme
2.2.
Monitoring Location
2.3.
Monitoring Methodology
2.3.1
Underwater noise study using dipping hydrophone
2.3.2
Dolphin acoustic behavioural
study using dipping hydrophone
2.3.3
Passive acoustic monitoring using EARs
2.4.
Data Analysis
2.4.1. Dipping
hydrophone data for underwater noise measurement
2.4.2. Dipping
hydrophone data for dolphin acoustic behaviour
2.4.3. EARs data for
passive acoustic monitoring
3.1. Summary
of acoustic monitoring effort
3.1.1. Pre-construction
phase
3.1.2. Construction
phase
3.2. Underwater
noise study (dipping hydrophone)
3.2.1. Pre-construction
phase results
3.2.2. Construction
phase results
3.3. Dolphin
acoustic behaviour study (dipping hydrophone)
3.3.1. Pre-construction phase
results
3.3.2. Construction
phase results
3.3.3. Pre-construction
and construction phase comparison of hydrophone data
3.4. Passive
acoustic monitoring (EARs)
3.4.1. Pre-construction
phase results
3.4.1.1. Site C1 �V Bridge Alignment Area
3.4.1.2. Site C2 �V Between Lung Kwu Chau and Sha Chau
3.4.2. Construction
phase results
3.4.2.1. Site C1 �V Bridge Alignment Area
3.4.2.2. Site C2 �V Between Lung Kwu Chau and Sha Chau
3.4.3. Pre-construction
and construction phase comparison of EAR data
4. DISCUSSION
4.1. Underwater
noise study (dipping hydrophone)
4.2. Dolphin
acoustic behavioural study (dipping hydrophone)
4.3. Passive
acoustic monitoring (EARs)
6. REFERENCES
The Tuen Mun-Chek
Lap Kok Link (TM-CLKL) comprises a 1.6 km long dual
2-lane viaduct section between the Hong Kong Boundary Crossing Facilities (HKBCF)
and the
According to Section 6.4.5. of the TM-CLKL EM&A
Manual, a bored piling monitoring programme in
relation to Chinese white dolphins (a.k.a
Indo-Pacific humpback dolphins, Sousa chinensis) shall be conducted during baseline and
construction phases. These include
underwater noise level measurements to evaluate the details of frequency and
intensity spectra of the bored piling noise in relation to dolphin acoustic behaviours, and dolphin acoustic behavioural
monitoring to record and note any changes in response of dolphins to the bored
piling noise. Such monitoring shall
be undertaken by qualified dolphin specialists who have sufficient relevant
post-graduate experience and publication in the respective aspects. Approval of the specialists responsible
for these bored piling monitoring studies shall be sought from AFCD and EPD,
and Drs. Bernd Würsig, Marc Lammers,
Lisa Munger and Katherine Kim were selected and
approved.
This monitoring assessment of underwater noise and
dolphin acoustic behaviour details the methodology,
and compares the results obtained for the initial baseline phase (26 September
to 25 October 2013) with results obtained during the construction phase (3
March to 28 April 2014) to meet the requirement in the particular specification
and EM&A Manual.
2.1.
Overall
Objective and Scheme
For the underwater noise study, the
primary objectives were to measure and characterize: (1) baseline ambient noise
levels during the pre-construction phase of development; and (2) industrial
noise levels associated with bored piling activities during the construction
phase. The results obtained from
this study, in conjunction with the concurrent dolphin acoustic behavioural and shore-based theodolite tracking studies,
would provide guidance with respect to mitigation for the resident dolphin
population.
On the other hand, the primary
objective of the dolphin acoustic behavioural study
was to investigate their acoustic behaviour and
movement in response to bored piling sites during both baseline and
construction phases. Overall, a set
of parameters such as the presence of dolphin acoustic signaling, durations of
periods of acoustic activity, relative occurrence of different kinds of signals
per unit time and shifts in the time of day of acoustic activity were
quantified. Other factors would
also need to be measured concurrently during baseline and construction phases
in order to understand whether any observed differences in acoustic behaviour of dolphins may represent a reaction to the bored
piling works, or are an artifact of other factors.
To achieve this primary goal, the
primary approach was to conduct dedicated acoustic surveys of focal follows of
Chinese white dolphins in North Lantau with sound recordings taken from a
dipping hydrophone deployed from the research vessel, and their movements near
the bored piling site were also monitored during focal follow sessions for both
baseline and construction phases.
These recordings were used to establish
baseline acoustic behaviour of the
dolphins (e.g. rate of sound production, types of
sounds), and its relation to visually determined dolphin group size, behaviour
(e.g. foraging, socializing, traveling, milling) and covariates such as the
time of day, Beaufort sea state, and occurrence of nearby vessels. Types, distances, and behaviours of vessels will be determined from the recording
vessel using laser rangefinder.
A complementary approach for the
acoustic data collection was to deploy two sets of ecological acoustic
recorders (EARs) near the bored piling site and at a control site for passive
acoustic monitoring during both baseline and construction phases. The EARs are bottom-moored, autonomous
acoustic recording systems that are used to monitor ambient sounds on a
programmable duty cycle (see detailed specifications of EAR in Lammers et al. 2008).
They have a programmable bandwidth up to 40 kHz and can be deployed from
days to months at a time. Based on
past experience in other areas, the effective detection range of EARs on
dolphin signals in
2.2.
Monitoring Location
To characterize the local soundscape, underwater sound
data collection was conducted mostly in the northeastern waters of
|
Northing |
Easting |
Number of Bored Piles |
Schedule of Marine Bored
Pile Construction |
|
|
B1 |
818342 |
814940 |
3 |
February
to May 2014 |
|
B2 |
818306 |
814987 |
2 |
March
to June 2014 |
|
B3 |
818261 |
815028 |
2 |
April
to August 2014 |
|
B5 |
818152 |
815081 |
2 |
May
to July 2014 |
|
B6 |
818094 |
815091 |
3 |
June
to August 2014 |
|
B7 |
818035 |
815093 |
2 |
July
to August 2014 |
Moreover, the dolphin acoustic behavioural
study was conducted concurrently with the underwater noise study mostly in the northeastern
waters of
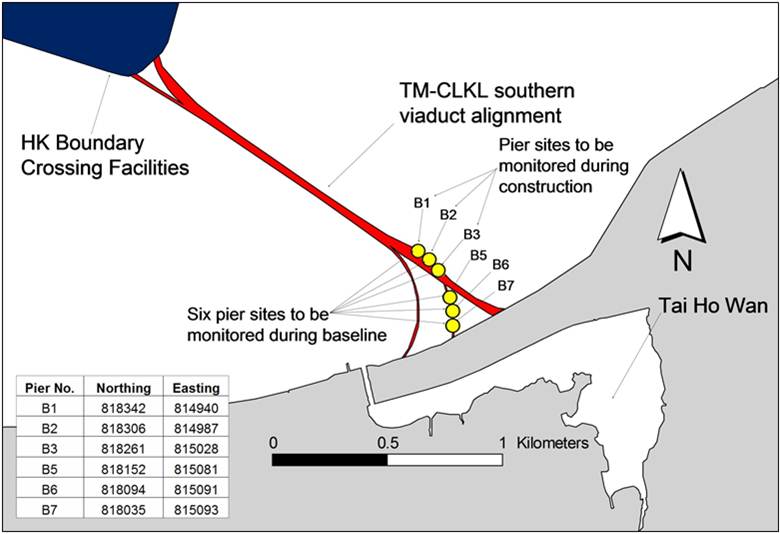
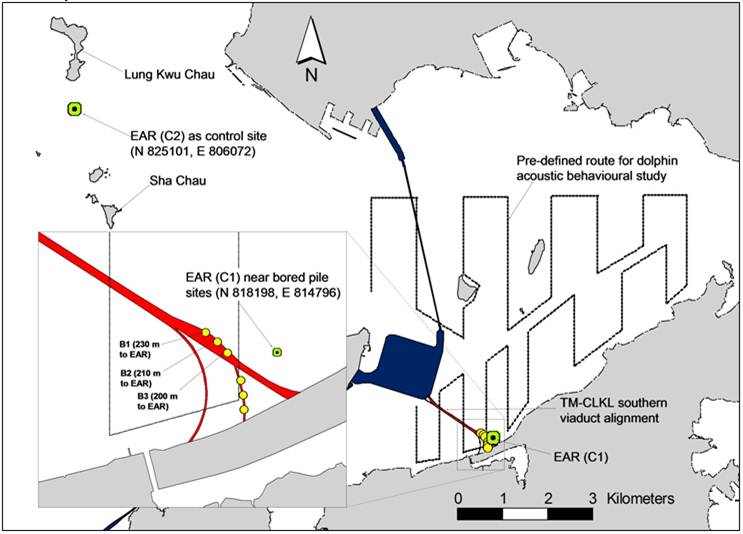
The EARs were deployed at two locations: 1) within 500 m
of the bridge alignment (Site C1: N22o18.158��, E113o58.109),
and 2) a control site between Sha Chau and Lung Kwu Chau (Site C2: N22o22.098��, E113o52.914��),
a less disturbed site relatively far away from the bridge alignment (Figure 2). The
site C1 near the bridge alignment is located 230m, 210m and 200m from bored
piling sites B1, B2 and B3 respectively.
The scientific permit obtained from AFCD to deploy the EAR within the Sha Chau and
2.3. Monitoring
Methodology
2.3.1. Underwater
noise study using dipping hydrophone
The acoustic data were collected on an underwater
sound recording system consisting of a high-sensitivity, high-bandwidth
hydrophone (International Transducer Corporation ITC-6050c) and two-channel
audio recorder (Sound Devices 702T).
The hydrophone was deployed from the stern of the research vessel, a
deployment scheme sometimes referred to as a ��dipping hydrophone��,
approximately mid-water column at a depth of 5 m beneath a 2 m spar buoy. The hydrophone cable was faired to
streamline water flow around the cable, reducing pseudonoise
and eliminating cable vibration.
The vessel would ��go quiet�� (its engine, generator, bilge pump, and
depth sounder turned off) and drift for the duration of each recording. The recording system and deployment
method generally followed that of another well-established study of underwater
sounds in
The
ITC-6050c is a wide-band hydrophone with a built-in, low-noise preamplifier for
optimum noise performance. Its
nominal operating band is 30 Hz to 70 kHz, and its self-noise level is well
below
Observers would document the recording date, start
and end times, hydrophone and water depths, Beaufort sea state, survey area,
and postamplifier gain in each recording. Wind speed, often directly correlated
with underwater levels, was measured and documented in the survey team��s
logs. The wind speed measurements
were performed with a handheld Kestrel 1000 anemometer, containing an impeller
with precision axle and low-friction bearings, providing 0.1 m/s resolution
between 0.6�V40.0 m/s and an accuracy (calculated using two standard deviations)
of the larger of 3% of the reading, least significant digit, or 0.1 m/s.
2.3.2. Dolphin
acoustic behavioural study using dipping hydrophone
During dedicated acoustic
surveys, the survey team of 2-3 HKCRP researchers conducted systematic search
for dolphins within the study area.
The survey protocol to search for dolphins was similar to the
line-transect survey methodology adopted in the vessel survey under the AFCD
long-term marine mammal monitoring programme (Hung 2012, 2013) as well as
various HZMB EM&A dolphin monitoring programmes. For each survey, a 15-m inboard vessel
with an open upper deck was used to make observations from the flying bridge
area, at a visual height of 4-5 m above water surface. The two observers searched with unaided
eyes and 7 x 50 marine binoculars ahead of the vessel (between 270o and 90o
in relation to the bow, which is defined as 0o). The survey team recorded effort data
including time, position (latitude and longitude), weather conditions (Beaufort
sea state and visibility), and distance travelled in each series (a continuous
period of search effort) with the assistance of a handheld GPS.
When dolphins were sighted, the survey team ended the
search effort, and the research vessel was diverted from its course to slowly
approach the animals for group size estimation, assessment of group composition,
and behavioural observations in the initial 5-10 minutes. The dipping hydrophone was then deployed
3 to 7 metres below the sea surface by 2-metre long spar buoy from the stern of
the research vessel, with vessel engine noise off and the vessel drifting. Broadband dolphin recordings were made
with the same set of underwater sound recording system as mentioned in Section
2.6.1 (see previous paragraph for detailed description). According to Section 6.4.5 of
the EM&A Manual, ��the acoustic
results of the monitoring should be analyzed in terms of both the broadband range (100 Hz to 25.6 kHz) and, also, the
dolphin sensitive range (400 Hz to 12.6 kHz).�� Dolphin acoustic data collected from the recording system was analyzed from 100 Hz and up to 40 kHz, which avoided a hydrophone resonance frequency at 50 kHz. This range would be sufficient to detect
the presence of dolphin acoustic signals and their temporal parameters (e.g.
click intervals), which is in compliance with the EM&A Manual requirement.
During the
dipping hydrophone deployment, the date, start and end times, hydrophone and
water depths, Beaufort sea state, survey area, locations, gain, event, and
notes were taken for each recording in five-minute intervals. Within each corresponding five-minute
interval, observers also noted variables including the group size, group
composition and general behaviour during the 5-minute period (i.e. feeding,
socializing, travelling, resting, milling and any aerial activity). The number of vessels that passed within
500 m of the dolphin group was recorded during the same 5-minute interval, with
special notes on close approaches by vessels within 100 m of dolphins,
including the time of closest approach and any behavioural reaction was noted. Distances of vessels were gathered by
hand-held laser rangefinder (Bushnell Yardage
Pro 800; maximum range of detection for most objects: 720 metres; ranging
accuracy �� 2 metres under most circumstances). Also, notes were made on the approximate
distance (i.e. 0-250m, 250-500m, >500 m) of the dolphin groups to the
hydrophone during the 5-minute interval.
Notably, positions of dolphin groups were recorded continuously during
the entire focal follow session to examine their movements in detail,
especially when they occurred in the vicinity of the TM-CLKL alignment.
2.3.3. Passive
acoustic monitoring using EARs
Two sets of
EARs were deployed at two sites in
The EARs were
programmed to record on a 20% duty cycle (1 minute ��on�� for every 5
minutes). Recordings were made from
approximately 20 Hz at the low end to 32 kHz at the high end, which effectively
covered a major part of the acoustic channel of Chinese White Dolphins (Sims et
al. 2011). Data from the EARs were
downloaded onto a computer hard disk at the end of each deployment period.
2.4. Data
Analysis
2.4.1. Dipping
hydrophone data for underwater noise measurement
For both baseline and
construction phases of the study, the acoustic data were analyzed
for narrowband spectra, one-third-octave band levels, and broadband
levels. The levels were tabulated
and summarized with respect to various noise contributors including but not
limited to vessels, wind, industrial activity, and biological sounds. Due to the transient nature of vessel
noise and the highly variable ambient noise levels encountered throughout the
study, the estimation of a single baseline noise level representative of the
study area was not feasible. However,
ambient noise levels were quantitatively characterized and their potential
masking effect on dolphin vocalization was discussed. In addition, for the construction phase
of the study, construction- related sounds were measured at different distances
from bored piling sites to allow estimation of a simple acoustic propagation
model for the region where bored piling activities will occur.
2.4.2. Dipping
hydrophone data for dolphin acoustic behaviour
To evaluate if dolphin acoustic behaviour
varies between baseline and construction phases, a number of parameters were
examined during both phases for comparison. For the calibrated hydrophone data,
parameters include the duration of acoustic encounters of dolphins and the
rates of their whistling and click production (echolocation and burst pulses)
per 5 min recording time bin. The
rates of sound production as a function of dolphin group size, behavioural state, location and time of day were also
examined.
For the comparison of response variables between baseline
and construction phases, each 5 min recording time bin was treated as a sample
point, providing a measure of the rate of whistling (whistles/min) and click
production (clicks/min). The rate
of whistling is quantified for each time period by visually and aurally
examining individual recordings and logging the presence of signals using the
program Raven Pro 1.5TM.
Click production (echolocation and burst pulses) was quantified using a
custom-written click detector program in MATLABTM R2011b. For the recording periods when the
dolphins were more than 500 m away or when they were on the bow of the research
vessel, those were excluded from consideration.
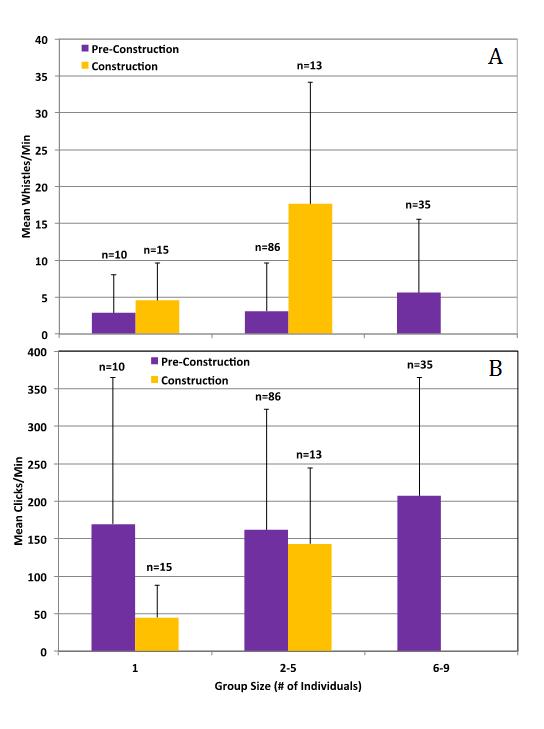
To investigate signal production as a function of dolphin
group size, the whistling and clicking rates were binned by group size as
follows: 1 individual dolphin, 2-5 dolphins, 6-9 dolphins, and 10+
dolphins. The whistling and
clicking rates were also similarly grouped by the behavioural
categories of milling, traveling, socializing, feeding and resting. Signal production by time of day was
investigated by grouping the number of sightings and rates of whistling and
clicking occurring in five two-hour periods of data collection (
2.4.3. EARs
data for passive acoustic monitoring
The data from EARs were analyzed by visually and aurally
examining individual recordings.
The presence of clicks and/or whistles was used to establish the
presence of dolphins near the EAR.
Analysts scanned spectrograms of each file in either a 60-second display
window (browsing mode) or a 10-second display window (verification mode). Dolphin sounds were confirmed visually
and aurally by playing back at reduced speed (usually to ½ original speed, and
in some cases ¼ speed).
The occurrence of dolphin signals was used to examine
temporal trends in dolphin presence and activity level, and to provide a
baseline for future comparison with the construction phase. The number and duration of dolphin encounters
was established for each day. Here
an encounter is defined as a period of recordings containing dolphin signals in
which the interval between detected signals is less than 30 minutes. For example, two recordings with
detections separated by 25 minutes would be treated as part of the same encounter, while two recordings with detections separated 40
minutes would be treated as two separate encounters. In addition, the overall acoustic behaviour (not per individual dolphin) was also established
and any changes in temporal patterns (e.g. from mostly calling at night, to
mostly during the day, or vice versa), or any increase/reduction and change in
the average duration of acoustic presence at the location of EAR deployment are
compared between baseline and construction phases.
3.1. Summary
of acoustic monitoring effort
3.1.1 Pre-construction
phase
Thirty days of acoustic monitoring surveys were conducted
between 26 September and
3.1.2 Construction
phase
Thirty-one days of acoustic monitoring surveys were
conducted between 3 March and
3.2. Underwater
noise study (dipping hydrophone)
3.2.1
Pre-construction
phase results
A total of 472 underwater
acoustic recordings were available for the underwater noise study. These sound files were quality-checked
to assess their suitability for noise analyses. For example, 32 recordings included mid-recording,
user-selectable, gain changes which introduced high-frequency artifacts most noticeable above
10�V20 kHz. These recordings were
discarded so as not to bias the acoustic results with electronic noise. After data quality checking, 440 recordings remained
for subsequent noise analyses.
In compliance with Section 6.4.5 of the EM&A Manual, the acoustic data were analyzed in terms of
both a ��wideband�� frequency range of 30 Hz to 40 kHz and a ��dolphin-sensitive��
frequency range of 400 Hz to 12.5 kHz.
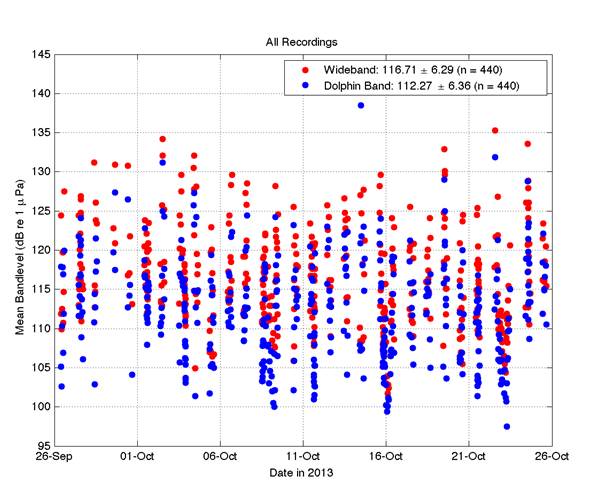
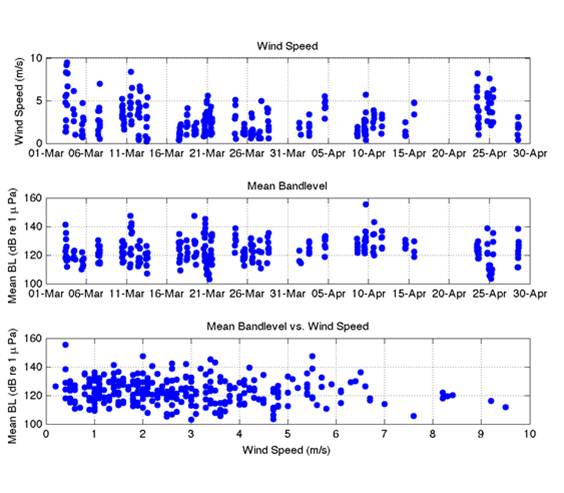
Figure 3 depicts the mean bandlevel
for each of the 440 recordings for the ��wideband�� frequency range (shown in
red) and the ��dolphin band�� (shown in blue). Bandlevels
were averaged over the duration of each recording, where recording durations
ranged from 1 minute, 58 seconds up to 6 minutes, with most recordings around 3
minutes in duration. As seen in Figure 3, wideband levels were always greater than
dolphin-band levels, as expected. Mean bandlevel
across all recordings (n = 440) was 116.71 �� 6.29 dB re 1 µPa for the wideband
case and 112.27 �� 6.36 dB re 1 µPa for the dolphin band case, where ���� x.xx�� refers
to one standard deviation from the mean and indicates the degree of variability
in the measurements.
In addition, as anticipated, bandlevels varied
greatly as a function of time, as illustrated in Figure 3,
but also within individual recordings.
This variability was due to the numerous transient noise sources, primarily transiting ships,
present in the waters off
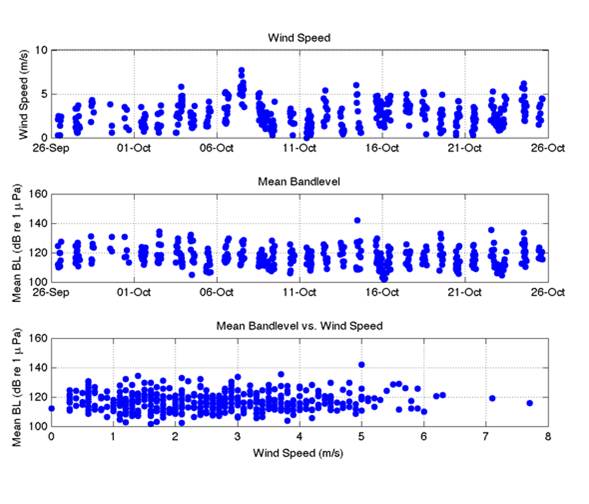
Wind and the subsequent sea surface waves it generates
are a common and well-known source of ambient noise in the world��s oceans. Wind speed was measured directly at the
time of each recording, and the related
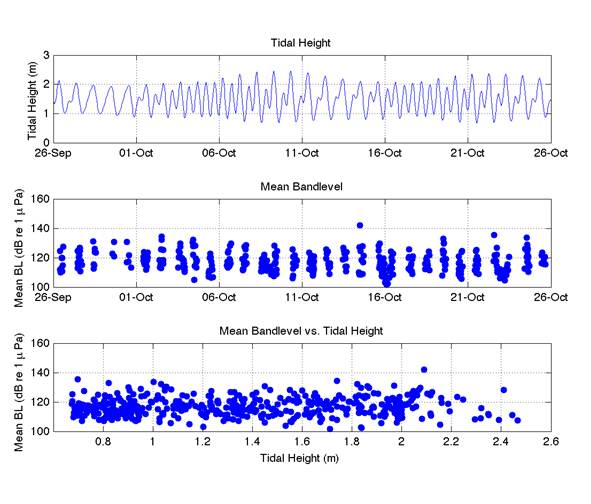
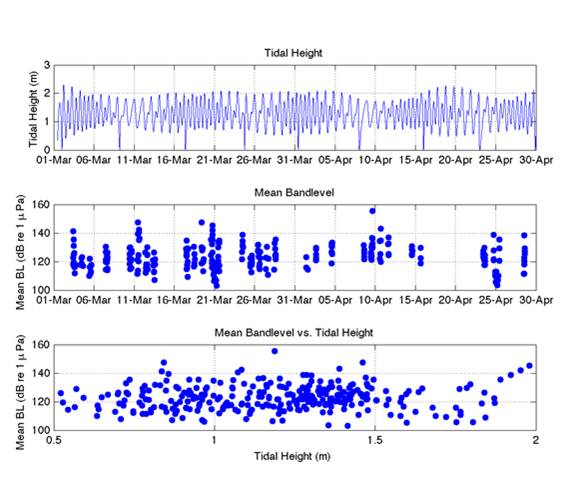
The potential effect of tides on ambient sound levels was
also investigated. Tidal height,
and by proxy, tidal current, can contribute to background noise levels in the
form of, e.g., rolling gravel or similar on the seafloor, but often takes the
form of ��pseudo-noise��, i.e., flow noise, which contaminates underwater
measurements. Figure
5 shows predicted tidal heights and measured bandlevels
throughout the study. No
significant correlation was found between tidal height and mean bandlevels (Pearson��s correlation coefficient of
0.10). The recording system, by
design, employed a spar buoy and faired hydrophone cable to mitigate cable
tension and flow noise, so no tidal effects were expected.
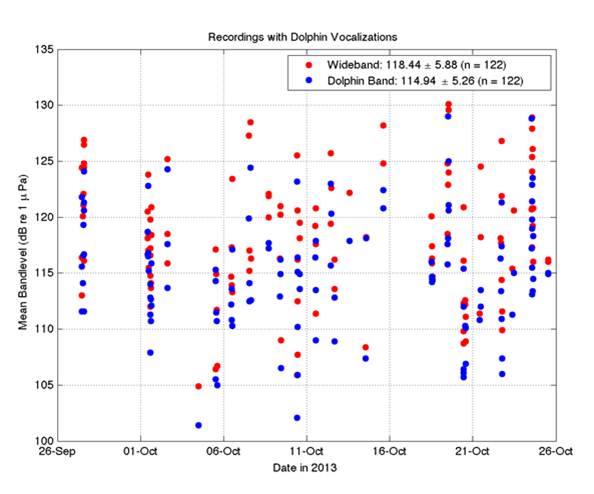
Of the 440 recordings utilized in the ambient noise
study, 122 recordings contained dolphin vocalizations. The mean bandlevels
for these recordings containing dolphin vocalizations are shown in Figure 6.
Average bandlevel across these recordings was
118.44 �� 5.88 dB re 1 µPa and 114.94 �� 5.26 dB re 1 µPa for the wideband
frequency range (red) and dolphin band (blue), respectively. By comparison, recordings without
dolphin vocalizations (n = 318) had average bandlevels
of 116.04 �� 6.33 dB re 1 µPa and 111.24 �� 6.46 dB re 1 µPa for wide and dolphin
frequency bands, respectively. Mean
bandlevel was calculated across the entire recording
and the bandwidth as indicated, regardless of the duration and frequency extent
of detected dolphin vocalizations.
Consequently, bandlevels for the recordings
containing dolphin vocalizations may not be representative of received levels
of individual dolphin vocalizations, and likely contain other sound sources
such as vessels, and, therefore, should be interpreted with caution. However, the large sample sizes and over
3 dB difference in average bandlevels
with and without dolphin vocalizations, notably manifest in the dolphin band,
suggest that dolphin vocalizations can contribute significantly to the
soundscape.
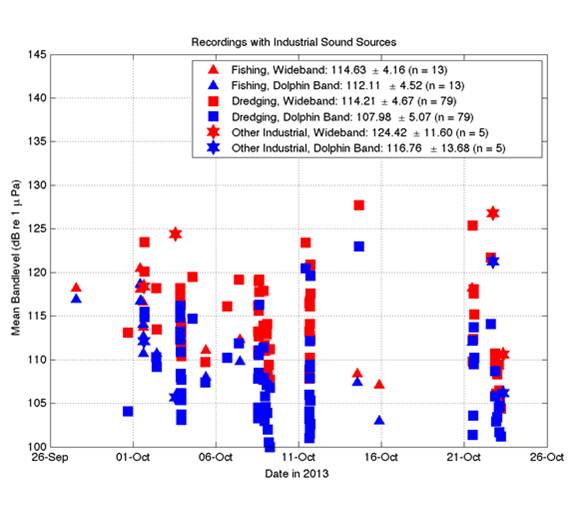
Field personnel documented actively operating industrial
activity that might contribute sound energy received by the recording
system. Figure
7 shows mean bandlevels for recordings annotated
with such industrial sound sources (n = 97), specifically, fishing activity
(depicted as triangles), dredging (depicted as squares), and other general
industrial activity (depicted as stars).
As in previous figures, red represents analyses over the wideband
frequency range and blue the dolphin-sensitive band. Figure 7 shows
broadband received levels and provides only a very rough indication of
broadband source levels of various industrial activities. Received levels are a function of
source-to-receiver range, and distances to sound sources shown in Figure 7 ranged from a gillnet fishing vessel operating 99
m from the hydrophone to dredging operations 1153 m away. Furthermore, the mean bandlevel was calculated across the entire recording, and
thus, measured sound levels represent other concurrent sound sources, such as
the many vessels documented during these recordings and/or potential dolphin
vocalizations. Vessels were present
in all of Figure 7��s recordings of industrial activity,
and, out of those 97 recordings, dolphin vocalizations were detected in ten of
them, notably nine of which involved fishing activity. Estimating source levels of
aforementioned industrial activity or of specific vessels is beyond the scope
of this study. However, Figure 7 does show received sound levels containing
concurrent industrial activity and unequivocally illustrates the high rate of
occurrence of such activity.
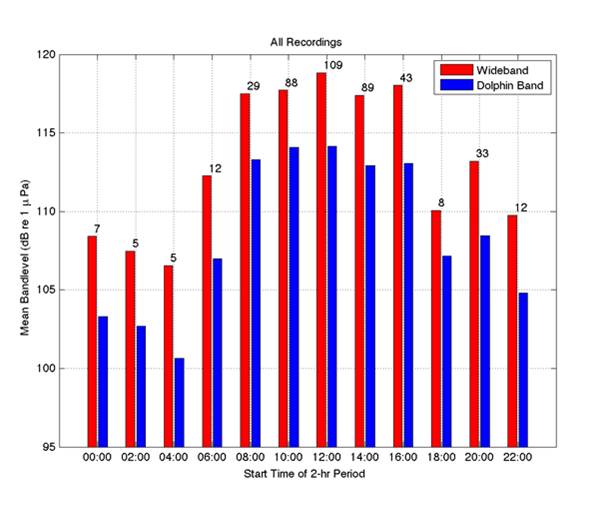
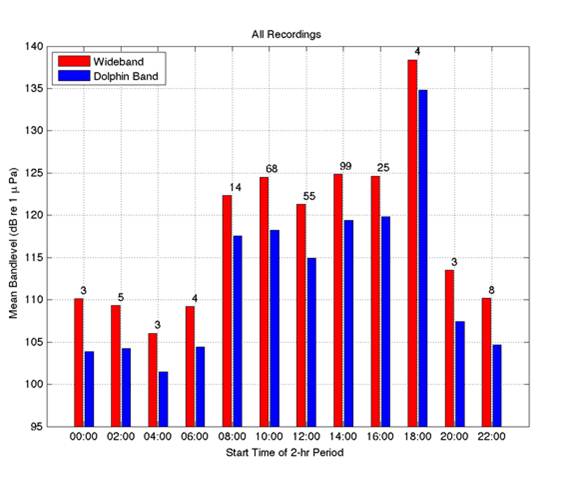
The soundscape��s time variability is demonstrated in Figure 8 in which mean bandlevels
for all 440 recordings are shown as a function of time of day, represented by
12 two-hour periods. Red and blue
represent the wideband frequency range and ��dolphin-sensitive�� band,
respectively, and, as expected, wideband bandlevels
are always higher than dolphin-band bandlevels. During the study��s October timeframe,
sunrise occurred at ~0600 HKT and sunset at ~1800 HKT. Figure 8 shows
increased sound levels between sunrise and sunset. Sample sizes are indicated by the
numbers above each bar in the histogram.
A bias might be present due to the relatively small sample sizes outside
daytime hours (n = 82, as compared to the sample size in daytime hours (n =
358)), but increased sound levels during daytime hours may also be attributed
to increased vessel traffic, fishing, construction, and other anthropogenic
activity more likely to occur during the day.
During the impact phase of this study, sounds associated
with bored piling activity were measured and subsequently modeled for
comparison to baseline phase ambient noise measurements. For the baseline
phase, sound levels were measured at different distances from proposed bored
piling pier locations on 3 October , 8 October, 11
October, 15 October, and
3.2.2
Construction
phase results
A total of 313 underwater acoustic
recordings, collected between
3 March and
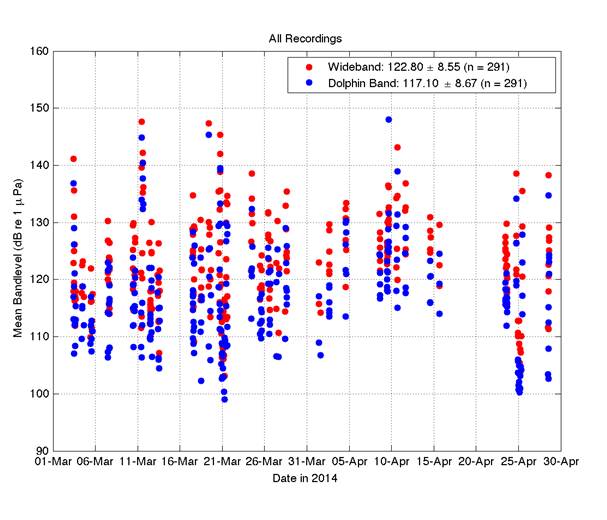
In compliance with Section 6.4.5 of the EM&A Manual,
the acoustic data were analyzed in terms of both a ��wideband�� frequency range
of 30 Hz to 40 kHz and a ��dolphin-sensitive�� frequency range of 400 Hz to 12.5
kHz. Figure 9 depicts the mean bandlevel
for each of the 291 recordings for the ��wideband�� frequency range (shown in
red) and the ��dolphin band�� (shown in blue). Bandlevels were
averaged over the duration of each recording, where recording durations ranged
from 1 minute, 30 seconds up to 7 minutes, with most recordings around 5
minutes in duration. As seen in Figure 9, wideband levels were always greater than
dolphin-band levels, as expected. Mean bandlevel
across all recordings (n = 291) was 122.80 �� 8.55 dB re 1 µPa for the wideband
case and 117.10 �� 8.67 dB re 1 µPa for the dolphin band case. These average bandlevels were ~5�V6 dB greater than those measured during
the baseline phase of the study (116.71 �� 6.29 dB re 1 µPa and 112.27 �� 6.36 dB
re 1 µPa, respectively). In
addition, as anticipated, bandlevels varied greatly
as a function of time, as illustrated in Figure 9, but
also within individual recordings.
This variability was due to the numerous transient noise sources,
primarily transiting ships, present in the waters off
Wind and the subsequent sea surface waves it generates
are a common and well-known source of ambient noise in the world��s oceans. Wind speed was measured directly at the
time of each recording, and the related
The potential effect of tides on ambient sound levels was
also investigated, as they were in the study��s baseline phase. Tidal height, and by proxy, tidal
current, can contribute to background noise levels in the form of, e.g.,
rolling gravel or similar on the seafloor, but often takes the form of
��pseudo-noise��, i.e., flow noise, which contaminates underwater
measurements. Figure
11 shows predicted tidal heights and measured bandlevels
throughout the study. Tidal
information was obtained from the Hong Kong Observatory��s Chek
Lap Kok Station
(www.hko.gov.hk/tide/eCLKtide.htm).
As in the baseline phase, no significant correlation was found between
tidal height and mean bandlevels (Pearson��s
correlation coefficient of 0.07).
The recording system, by design, employed a spar buoy and faired
hydrophone cable to mitigate cable tension and flow noise, so no tidal effects
were expected.
The soundscape��s time variability is demonstrated in Figure 12 in which mean bandlevels
for all 291 recordings are shown as a function of time of day, represented by
12 two-hour periods. Red and blue
represent the wideband frequency range and ��dolphin-sensitive�� band,
respectively, and, as expected, wideband bandlevels
are always higher than dolphin-band bandlevels. During the study��s March through April
timeframe, sunrise occurred around roughly
A primary objective of this study was to measure and
empirically model sounds associated with bored piling activity and to compare
those results with the study��s baseline phase ambient noise measurements. Table 1
summarizes the ambient sound levels measured at varying distances from bored
piling pier locations over five days of the baseline phase of the study. The mean bandlevels
given in Table 1 are approximately 114 dB re 1 µPa and
108 dB re 1 µPa for the wideband frequency range and for the dolphin-sensitive
band, respectively. Throughout the construction phase of this study (over 31
days), sounds levels were measured at different distances from bored piling
pier locations B1, B2, and B3, and concurrent construction-related activity
associated with bored piling was noted in log files. Typical sequence construction-related
bored piling activities included pre-drilling, casing, soil grabbing, welding,
reversed circulation drilling (RCD), air lifting, caging, and concreting. Brief explanations of these activities
are as follows:
�P
Predrilling
Predrilling involves site investigation work to determine the
founding level prior to construction of the bored pile.
�P
Casing
A metal case of designed diameter is vertically sunk by a
vibratory hammer at the bored pile location, and excavation (see soil grabbing
below) is carried out inside the casing.
�P
Soil grabbing
Marine deposits and alluvial clay inside the casing is removed by
a mechanical grab until the grab reaches the rock strata.
�P
Welding
Piles are welded together for approaching the target depth.
�P
Reverse Circulation Drill (RCD)
Upon reaching the rock strata, the RCD is used to form the rock
socket.
�P
Airlifting
Airlifting is a process of cleaning the pile base by flushing with
water, which is desisted and recycled in the airlifting process.
�P
Caging
Steel reinforcement, an integral part of the bored pile structure,
is fabricated off-site and vertically lowered into the pile bore by crawler
crane.
�P
Concreting
Concrete is poured by underwater tremie
method to form the bored pile structure.
Although differentiated in Table 2,
locations B1, B2, and B3 were anticipated to yield similar received sound
levels due to their close proximity to each other (59.2 m between B1 and B2,
60.9 m between B2 and B3) and, thus, similar acoustic propagation environments. Furthermore, although not anticipated
prior to the field study, different bored piling activities at locations B1,
B2, and B3 were often underway at the same time, prohibiting isolation of one
bored piling sound source from another.
The hypothesized similarity among the three pier locations is supported
by comparing the sound levels for B1, B2, and B3 in Table 2. Considering piers B1, B2, and B3
collectively, the sample size for each construction activity ranged from nine
to 44 acoustic records. Table 2 lists the mean wideband and dolphin band sound
levels measured during each type of bored piling activity, with sample sizes
noted parenthetically. Average bandlevels for all measurements represented in Table 2 are 125.02 �� 5.30 dB re 1 µPa and 118.68 �� 5.53 dB
re 1 µPa for the wideband frequency range and for the dolphin-sensitive band,
respectively. Note that the
measurements in Table 2 encompass multiple
source-to-receiver distances (and assumes the source in question is the noted
bored piling activity) and are not indicative of source levels. They do illustrate, however, the
relatively small variation among and within measurements of different bored
piling activities, as well as of measurements among pier locations. This assumes the source in question is
the noted construction activity at a given pier location; since different bored
piling activities were often conducted concurrently at B1, B2 and B3 pier
locations, this is a necessary assumption.
The measurements in Table 2 also indicate that
average bandlevels in the vicinity of the
construction site during the study��s construction phase were consistently
higher than those during the study��s baseline phase. In addition, the variability in bandlevels, in terms of standard deviation from the mean
value, was also generally greater for the study��s construction phase compared
to the baseline phase.
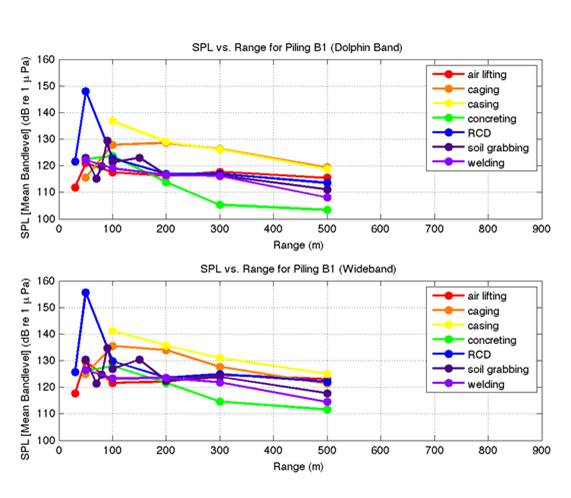
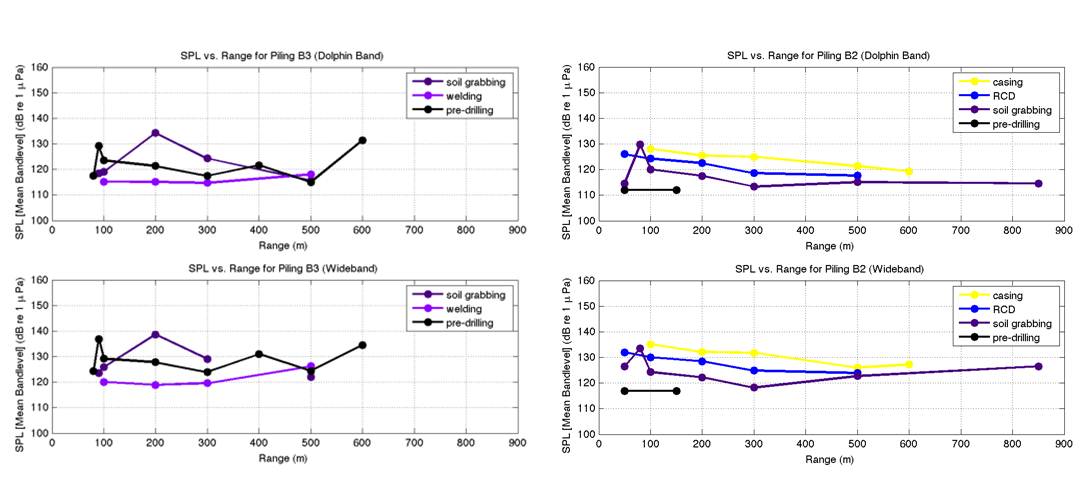
The bored piling sound measurements of Table
2 are shown in Figure 13 (for pier B1). Figure 14a (for pier B2) and Figure 14b (for pier B3) as a function of range[KHK1] ,
or distance between the given bored piling pier location and the
hydrophone. SPL as a function of
distance for pier B3 was similar to that for B1 and B2. Specifically, the shape of the
SPL-versus-range curve was roughly flat, and SPL values ranged from ~120 to
~140 dB re 1 µPa for the three bored piling activities measured at pier B3,
namely, soil grabbing, welding, and pre-drilling activities. Table 3 lists the
sample sizes for each circle shown in Figures 13, 14a and 14b.
For each type of construction activity, opportunistic measurements were
made at a variety of ranges from the pier location(s), from tens of meters to
hundreds of meters, sufficient for estimating an empirically-derived
propagation model. In Figures 13 and 14, the
highest received sound level of 148.0 dB re 1 µPa (dolphin band; 155.6 dB re 1
µPa, wideband) was measured at a distance of 50 m from RCD activity. However, the seven remaining acoustic
records for RCD activity at or closer in range were substantially lower in
sound level: 119.2�V131.6 dB re 1 µPa (dolphin band; 123.3�V136.8, wideband),
suggestive that the 148.0/155.6 dB re 1 µPa measurement was not indicative of
RCD activity but was likely due to a different, non-bored-piling-related,
concurrent sound source. Indeed,
during the recording in question, the CPA of one tug boat was 164 m, and four
sampans were observed within 16�V63 m of the hydrophone.
Noteworthy is the shape of each colored curve
representing a different construction activity. Each curve was fitted to an
acoustic propagation model of the form:
SPL
= C1+ C2 log(R) + C3 R
where SPL is in units of dB re 1
mPa
for a given range R in meters between the sound source and recording hydrophone
and regression coefficients C1, C2, and C3. The second, logarithmic term in the
above equation represents spreading loss for the study site. For this shallow-water environment, it
was anticipated that the second term would be a combination of spherical
(20logR) and cylindrical spreading (10logR), a result of reflection,
absorption, and refraction of sound energy in this waveguide. The third, linear term represents
scattering and absorption losses in the seawater and sub-bottom and at seafloor
and sea surface interfaces. If the
transient bored piling-related noise emanating from the pier locations exceeded
current ambient sound levels, one would expect to see a monotonic decrease in
sound levels on the order of 10logR to 20logR. However, as one can surmise by the shape
of the curves in Figures 13 and 14,
the regression never yielded physically meaningful values for C2
between -20 and -10. In other
words, the range dependence of received levels was weak, i.e., the curve fits
did not consistently extrapolate back to a louder-than-ambient source level,
which suggests that bored piling noise was quiet relative to ambient noise
levels.
To eliminate the possibility of daily variability on the
soundscape affecting the empirical model, regression fits were also performed
for data collected on a daily basis; nevertheless, estimated C2
values remained outside acceptable values.
This suggests that bored piling sounds did not exceed ambient noise
levels. Instead, the acoustic
records obtained concurrent with bored piling activities were likely dominated
by other sound sources, e.g., transiting vessels. Observer logs noted the presence of
numerous vessels throughout the recordings: ferries, container ships, fishing
boats, tug boats, police vessels, and so on, as well as occasional
construction-related vessels.
Attempts to parse the acoustic data to isolate construction sounds of
interest proved futile due to the large number of transient sound sources whose
presence in the audio files often did not correspond to the timing of visual
observations of vessels. In
addition, concurrent sound energy from nearby construction-related noise (some
related to bored piling efforts, others not) prohibited isolation of one
construction-related sound source from another. Consequently, the sound levels reported
herein were calculated across the full extent of each acoustic record,
including all transients. While
this approach does not produce estimates of sound levels indicative of
individual bored piling activities (which would be impossible to estimate when
bored-piling-related sounds are masked by other sound sources and/or occurring
concurrently), one can conclude from these measurements that the soundscape is
dominated by vessel noise, and bored piling sounds in this environment are
negligible.
3.3. Dolphin
acoustic behavioural study (dipping hydrophone)
3.3.1
Pre-construction
phase results
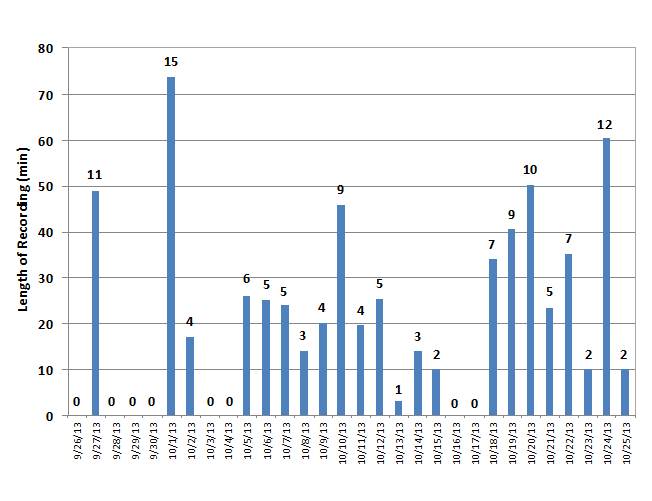
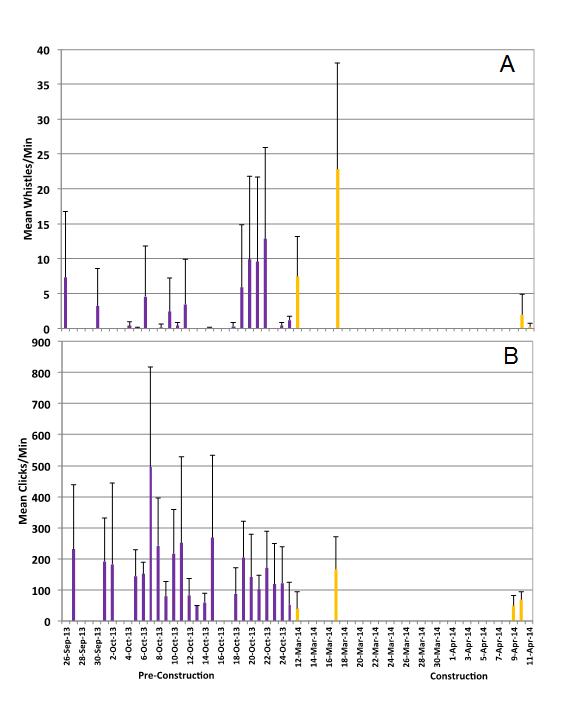
A total of 629 recording minutes were made. Figure 15 shows
the number of recording minutes summed for each day, as well as the number of
sightings per day. Recordings were
obtained on all but 8 days of the 31-day period. The daily number of 5-minute recordings
ranged between 0 and 15 (mean = 4.4, stdv = 4.1) and
the daily number of minutes recorded was between 0 and 73.4 (mean = 21.0, stdv = 20.1).
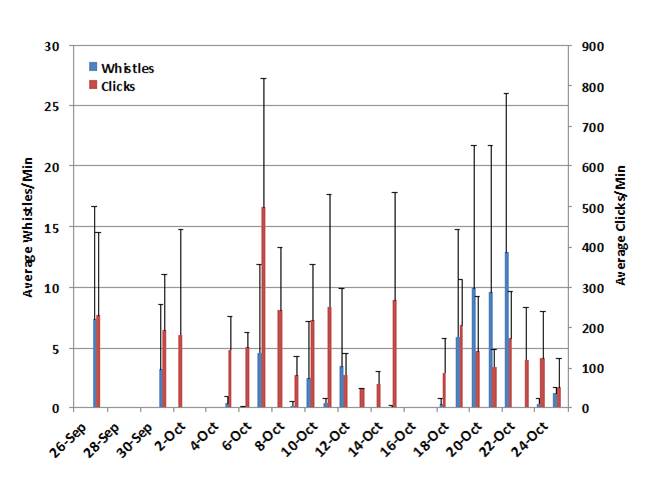
Whistling and clicking rates were determined for all
recordings (n =131). Figure 16 shows the daily rate of click and whistle
production recorded. The mean daily
whistling rate was 2.8 whistles/min (stdv = 3.9) and
the mean click production rate was 165.9 clicks/min (stdv
= 100.0).
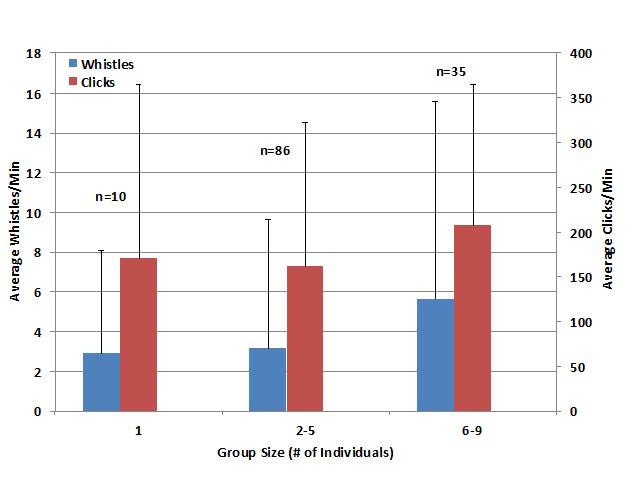
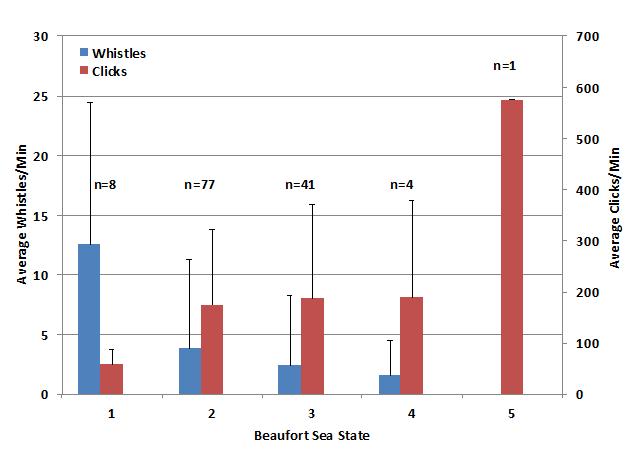
The variability of whistling and clicking rates was
examined as a function of group size, behavioural
state, time of day, Beaufort sea state and location within the study area. Figure 17 shows
the rate of both click and whistle production as a function of group size. The rate of whistling generally
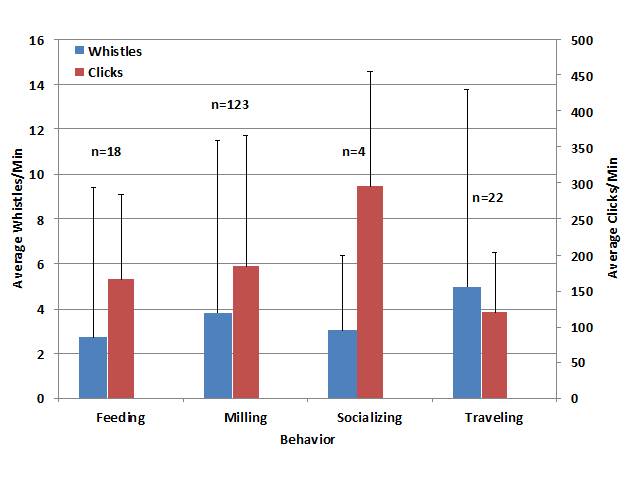
increased with group size while the rate of click production did not vary much. In Figure 18 the rate of signaling is represented in
relation to the dolphins�� observed behavioural state
during the recording period. Milling
was the most common behavioural state noted.
Whistling rates did not vary greatly across behavioral states. However, the rate of click production
was greatest when the animals were observed socializing.
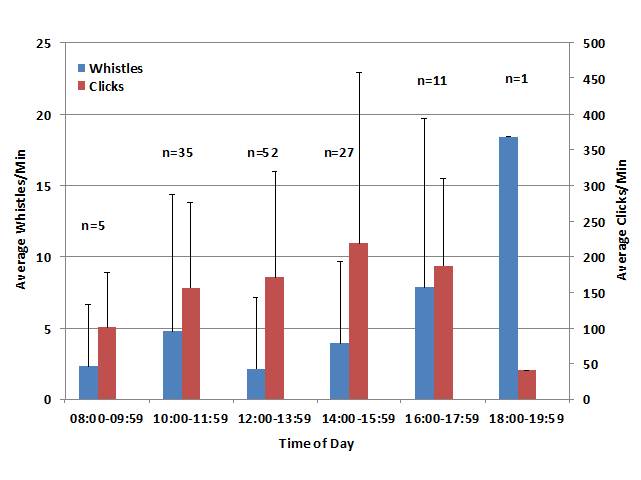
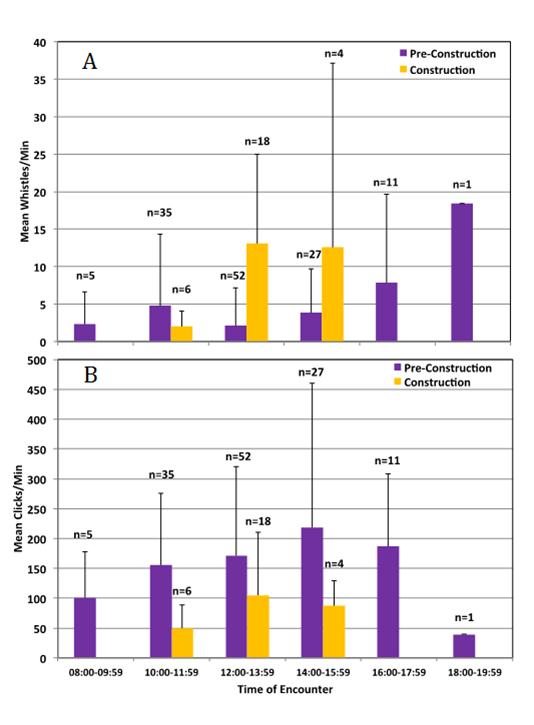
The greatest number of recordings were made during the
12:00-13:59 time period (n = 52), followed by the 10:00-11:59 period (n = 35),
the 14:00-15:59 period (n = 27), the 16:00-17:59 period (n = 11), the 8:00-9:59
period (n = 5) and lastly the 18:00-19:59 period (n = 1) (Figure
19). Not counting the
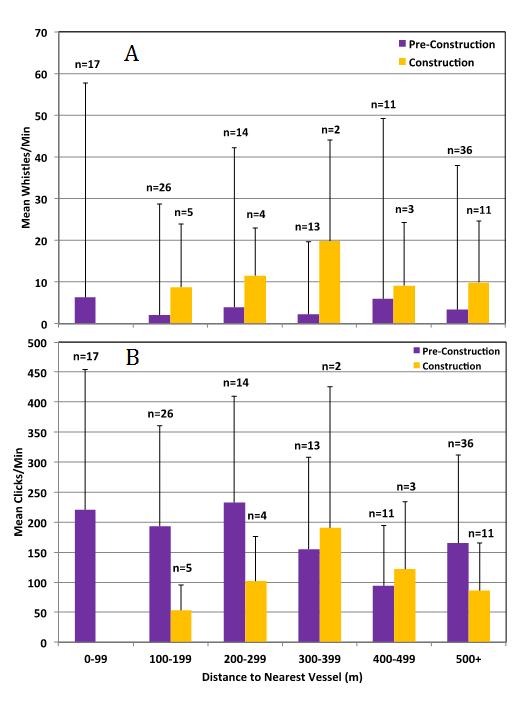
A total of 117 recordings were made with vessels
transiting nearby. Of these, 17
were with vessels between 0 and 99 m at the closest approach, 26 were between
100 and 199 m, 14 were between 200 and 299 m, 13 between 300 and 399 m, 11
between 400 and 499 m, and 36 were 500 m or further away. There was a wide variation in both
clicking and whistling rates for vessels at all six range categories (Figure 20).
No specific conclusions can be drawn about the effects of vessel
distance on signaling rate from these data.
Recordings were collected in
The location of each recording and the division of the
study area into two zones are shown in Figure 22. Zone
1b includes the construction area, while Zone 1a is to the west of the
construction area. An approximately
equal number of recordings were made in Zones 1a (n = 65) and 1b (n = 66). The
rates of clicking were equivalent between Zones 1a and 1b (Figure
23). However, considerably more
whistles were recorded in Zone 1b. This difference was highly significant
(Mann-Whitney U Test, U = 849.5, p < 0.001).
3.3.2 Construction
phase results
A total of 185 recording minutes were made. Figure 24 shows
the number of recording minutes summed for each day, as well as the number of
sightings per day. Recordings were
obtained on only 4 days of the 31-day period. The daily number of 5-minute recordings
ranged between 0 and 10 (mean = 0.9, stdv = 2.5) and
the daily number of minutes recorded was between 0 and 51.1 (mean = 0.003, stdv = 0.009).
Whistling and clicking rates were determined for all
recordings (n =28). Figure 25 shows the daily rate of click and whistle
production recorded. The mean daily
whistling rate was 1.1 whistles/min (stdv = 4.5) and
the mean click production rate was 10.1 clicks/min (stdv
= 35.5).
The variability of whistling and clicking rates was
examined as a function of group size, behavioural
state, time of day, Beaufort sea state and location within the study area. Figure 26 shows
the rate of both click and whistle production as a function of group size. The rates of both whistling and
click-production increased with group size. In Figure 27,
the rate of signaling is represented in relation to the dolphins�� observed behavioural state during the recording period. Milling was the most common behavioural state noted, with only four recording periods
representing the remaining three behavioural
categories. Whistling rates and
click-production rates were greatest during socializing, but this is based on
only one recording period.
The greatest number of recordings were made during the
A total of 25 recordings were made with vessels
transiting nearby. Of these, 5 were
with vessels between 100 and 199 m at the closest approach, 4 were between 200
and 299 m, 2 were between 300 and 399 m, 3 between 400 and 499 m, and 11 were
500 m or further away. No
recordings were made with vessels at distances between 0 and 99 m. The highest rates of whistling and click
production occurred with vessels 300-399 m away (Figure 29). However, the recording sample sizes at
the various distance categories were too small to draw any specific conclusions
about the effects of vessel distance on signaling rate from these data.
Recordings were collected in
As the survey effort was primarily conducted in the
northeastern waters of Lantau during the construction phase, all 28 recordings
made during the construction phase of the project were made in Zone 1b, which
includes the construction area. Figure 31 shows the mean rates of whistling and click
production in Zone 1b during this period.
3.3.3 Pre-construction
and construction phase comparison of hydrophone data
Almost five times the total number of recordings were
made during the pre-construction phase (n = 131) as during the construction
phase (n = 28), reflecting a significantly lower sighting rate during the
latter period (Mann-Whitney U Test on # encounters per day, Z = 5.099, p <
0.001). The average number of
encounters per day during pre-construction phase was 1.70 (SD = 1.37), and the
average number of encounters per day during construction phase was 0.13 (SD =
0.35). The summed length of
recordings obtained on days when dolphins were encountered was approximately
equivalent between project phases (Figure 32). However, the average dolphin group sizes
encountered between the pre-construction and construction phases were 3.5 (S.D.
= 1.6) and 1.9 (S.D. = 1.0), respectively, indicating that dolphin group sizes
were smaller during the construction phase.
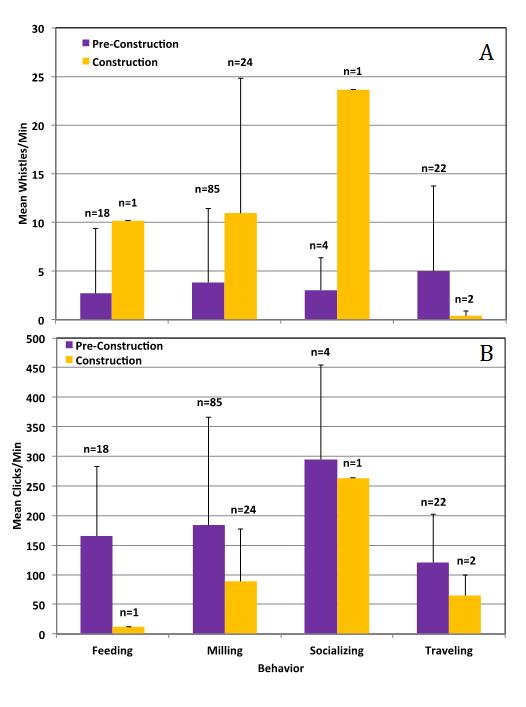
Comparisons of whistling and clicking rates were made,
respectively, between the pre-construction and construction phases as a
function of behavioral state (Figure 33), group size (Figure 34), the distance to the nearest vessel (Figure 35) and the time of day (Figure
36). Differences between pre-construction and construction phases are noted
in the whistle and/or click production rates of dolphins among several of these
variables. However, the small sample
size of data obtained during the construction phase (only 4 encounters)
compared to the pre-construction phase (51 encounters) does not warrant drawing
conclusions based on statistical inference. Therefore, any differences recorded in
these comparisons of whistling and click rates between the two phases of the
study must be viewed with caution, as these may be artifacts of the small
sample sizes obtained during the construction phase.
Lastly, Figures 37a and 37b show
the averaged daily whistling and clicking rates,
respectively, for both phases of the study. The highest rate of whistling was
recorded during a construction-phase encounter that occurred on
3.4. Passive
acoustic monitoring (EARs)
3.4.1 Pre-construction
phase results
The EAR at Bridge Alignment Area (Site C1) was deployed
between 27 September and
3.4.1.1 Site C1 �V
Bridge Alignment Area
Dolphin signals were detected on 26 out of 30 days of EAR
recordings at this site. Figure 38 shows the
percentage of files for each day (288 recordings per day) that contained
dolphin signals. Daily dolphin acoustic activity was low, with between 0% and
4.5% of recordings containing dolphin signals any given day. Figure 39 shows
the number of dolphin encounters (as defined in section 2.7.3) and the average
duration of encounters for each day of the deployment period. There were an average of 4.0 encounters
per day (S.D. = 3.5) at site C1, which lasted and average of 1.9 min (S.D. =
3.6).
Figure 40 shows the occurrence
of dolphin acoustic signals in EAR recordings at site C1 as a function of the
hour of the day. All detections
were of dolphin click trains. No
detections were made of dolphin whistles.
Two possible explanations for this are that in this area a) dolphins
engage in little or no socializing activities (typically characterized by
whistling), or b) ambient and/or anthropogenic noise in the frequency bands
associated with whistles (4-12 kHz) masked any whistles that were present. However, a comparison of the ambient
noise levels at sites C1 and C2 revealed that the average root-mean-square
(RMS) sound pressure levels (SPLs) in the 4-8 kHz and 8-16 kHz bands were 95.4
dB (S.D. = 1.7) and 95.4 dB (S.D. = 2.2), respectively at site C1, and 96.8 dB
(S.D. = 1.8) and 96.3 dB (S.D. = 1.7), respectively at site C2. Since these ambient noise levels are
very similar at both sites and dolphin whistles were regularly detected at C2(see section 3.4.2 below), it is highly unlikely that
masking by noise at site C1 was the principal reason why whistle detections
were absent at this location.
Consequently, it can be assumed that dolphins likely do not produce many
whistles at or near site C1 and that the amount of any noise masking is not
greater than at site C2.
Approximately 54% of detections occurred during the
nighttime period between
Figure 41 shows the RMS SPL in
1-octave bands and full bandwidth, averaged hourly at site C1. The ambient
noise level was highest in the 0-2 kHz frequency band, which was driven by
vessel traffic, and lowest between 2-4 kHz (mean and standard deviation 102.8
dB re 1 �gPa (SD = 5.3) and 91.9 dB re 1 �gPa (SD = 2.4), respectively). There was a sudden and unexpected
decrease in the ambient noise levels between 2-32 kHz beginning
on 5 October. It is presently
unclear what caused this sudden change, but it may have resulted from either a
perturbation of the nearby benthic fauna or a shift in sea surface conditions
(see discussion below). At site C1,
the average full-band RMS SPL measured was 105.6 dB re 1 �gPa
(S.D. = 2.6) during the pre-construction phase.
3.4.1.2 Site C2 �V
Between Lung Kwu Chau and Sha
Chau
Dolphin signals were detected on all 30 days of EAR data
that were recorded at site C2. Figure 42 shows the percentage of files for each day (288
recordings per day) that contained dolphin signals. Daily dolphin acoustic activity was
variable, with between ~1% and 28% of recordings containing dolphin signals any
given day. Figure
43 shows the number of dolphin encounters (as defined in section 2.7.3) and
the average duration of encounters for each day of the deployment period. There were an average of 8.6 encounters
per day (S.D. = 2.0) at site C2, which lasted an average of 25.0 min (S.D. =
14.3).
Figure 44 shows the occurrence
of dolphin acoustic signals in EAR recordings as a function of the hour of the
day. Although the majority of
detections at site B2 were also of click trains, whistles were also regularly
detected at this site. In addition,
there was only a weak diel trend in the occurrence of
detections, with approximately 53% of click train detections and 60% of whistle
detections occurring during the nighttime period between
Figure 45 shows the
root-mean-square (RMS) sound pressure level (SPL) in 1-octave bands and full
bandwidth averaged hourly at site C2.
Average noise levels for each octave band for the entire deployment
ranged from 93.3 to 96.7 dB re 1 �gPa (SD 2.0 - 4.8)
and were within 3 dB re 1 �gPa across all frequency
bands between 0-32 kHz. The average full-band RMS SPL was 102.8 dB re 1 �gPa (S.D. = 1.8) during the pre-construction phase. However, SPLs in the 0-2 kHz band
exhibited daily variations of up to 14 dB due to noise contributions from vessels
and a biological evening chorus produced by one or more unknown species of fish
and/or invertebrates. Overall,
broadband noise levels above 2 kHz were higher at site C2 than at C1, but
levels below 2 kHz were higher at C1 due to a greater daytime noise
contribution from vessel traffic.
3.4.2 Construction
phase results
The EAR at the Bridge Alignment Area (Site C1) collected
data between 6 March and
3.4.2.1 Site C1 �V
Bridge Alignment Area
Dolphin signals were detected on only 5 out of 30 days of
EAR recordings at this site. Figure 46 shows the percentage of files for each day (288
recordings per day) that contained dolphin signals. Daily dolphin acoustic
activity was very low, with between 0% and 0.4% of recordings containing
dolphin signals any given day. Figure 47 shows the number of dolphin encounters (as
defined in section 2.7.3) and the average duration of encounters for each day
of the deployment period. There
were an average of 0.17 encounters per day (S.D. = 0.38) at site C1, which
lasted an average of 0.83 min (S.D. = 1.9).
Figure 48 shows the occurrence
of dolphin acoustic signals in EAR recordings at site C1 as a function of the
hour of the day. Detections were
made of both dolphin whistles and click trains. All five detections were made during
daytime hours, primarily in the morning between
Figure 49 shows the RMS SPL in
1-octave bands and full bandwidth averaged hourly at site C1. The ambient noise
level was highest in the 0-2 kHz frequency band, which had an average RMS SPL
over the entire data collection period of 104.7 dB re 1 �gPa
(S.D. = 9.2), likely driven by vessel traffic. Average RMS SPL for the other
frequency bands ranged from 93.1 to 98.5 dB re 1 �gPa
(S.D. 2.6 - 4.1), and the average full-band RMS SPL measured at C1 was 108.1 dB
re 1 �gPa (S.D. = 5.8) during the construction phase.
Unlike during the pre-construction phase, no sudden change was observed in the
ambient noise levels between 2-32 kHz.
Rather, a diel pattern of increase in the 0-2
kHz acoustic energy band was recorded, which was tied to bridge construction
activities. Noise began to increase
at approximately
3.4.2.2 Site C2 �V
Between Lung Kwu Chau and Sha
Chau
Dolphin signals were detected on all 30 days of EAR data
that were recorded at site C2. Figure 50 shows the percentage of files for each day (288
recordings per day) that contained dolphin signals. Daily dolphin acoustic activity was
variable, with between ~2% and 16% of recordings containing dolphin signals any
given day. Figure 51 shows the number of dolphin
encounters (as defined in section 2.7.3) and the average duration of encounters
for each day of the deployment period.
There were an average of 7.0 encounters per day (S.D. = 3.1) at site C2,
which lasted and average of 16.0 min (S.D. = 9.6).
Figure 52 shows the occurrence
of dolphin acoustic signals in EAR recordings as a function of the hour of the
day. The vast majority of
detections at site C2 were of click trains. Whistles were only rarely detected
during this deployment. There was a
moderate diel trend in the occurrence of detections,
with approximately 62% of click train detections and 67% of whistle detections
occurring during the nighttime period between
Figure 53 shows the
root-mean-square (RMS) sound pressure level (SPL) in 1-octave bands and full
bandwidth averaged hourly at site C2.
Average noise levels for each frequency band ranged from 93.4 to 99.9 dB
re 1 �gPa (S.D. 1.9 - 6.1) and were within 3-4 dB re 1
�gPa of each other across all frequency bands between
0-32 kHz. At site C2, the average full-band RMS SPL measured was 104.3dB re 1 �gPa (S.D. = 3.3) during the construction phase. A diel pattern
of increase in the 0-2 kHz acoustic energy band began in late March. During this period, low frequency
acoustic energy peaked between approximately
3.4.3 Pre-construction
and construction phase comparison of EAR data
Differences were present between the EAR data obtained
during the pre-construction and construction phases at both monitoring
sites. Figures
54a and 54b show the daily percentage of recordings with dolphin signals
present during both phases of the study at C1 and C2, respectively.
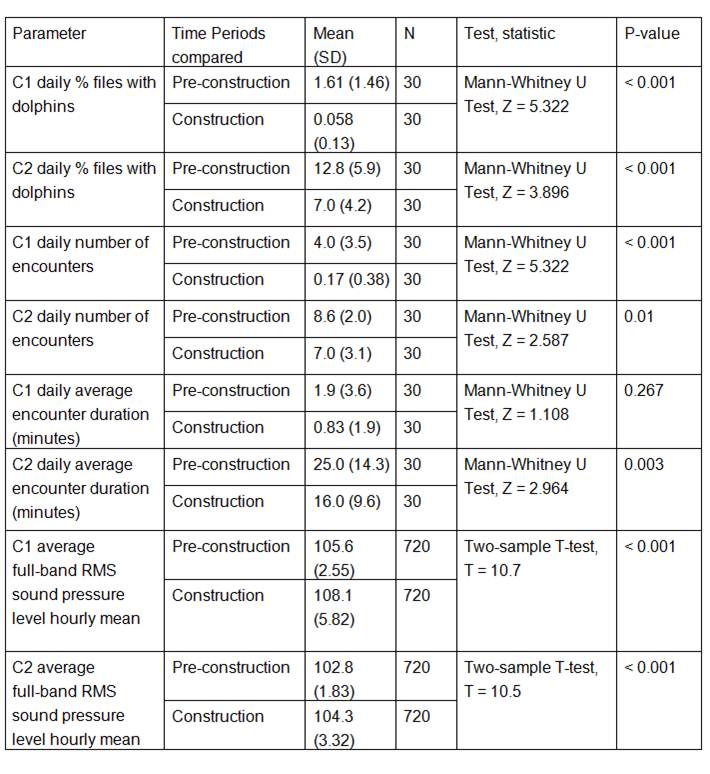
Significantly fewer files contained dolphin detections during the construction
phase at both C1 (Mann-Whitney U Test, Z = 5.322, p < 0.001) and C2
(Mann-Whitney U Test, Z = 3.896, p < 0.001) (statistical parameters and
results summarized in Table 4). Similarly, the numbers
of encounters (as defined in section 2.4.2) were fewer at both sites during the
construction phase (C1: Mann-Whitney U Test, Z = 5.322, p < 0.001; C2:
Mann-Whitney U Test, Z = 2.587, p = 0.01) (Table 4). The encounter durations were not
significantly different at C1 between project phases (Mann-Whitney U Test, Z =
1.108, p = 0.267), but were lower during the construction phase at C2
(Mann-Whitney U Test, Z = 2.964, p = 0.003) (Table 4).
Although differences in dolphin activity were observed at
both monitoring locations between project phases, the magnitude of change was
not equivalent between sites. At
site C1 (Bridge Alignment Area) the mean daily percentage of recordings with
detections changed from 1.61% (S.D. = 1.46) to 0.05% (S.D. = 0.13), a more than
32-fold decrease. In comparison,
the mean daily percentage of recordings with detections at site C2 (Between
Lung Kwu Chau and Sha Chau)
changed from 12.8% (S.D. = 5.9) to 7.0 (S.D. = 4.2), representing less than a
two-fold decrease. At C2, however,
a substantial change was noted in the occurrence of whistles between project
phases. Approximately, 12% of
detections made at site C2 contained whistles during the pre-construction
phase, compared to < 1% during the construction phase.
Figures 55a and 55b show the
number of hourly detections made during each phase at sites C1 and C2,
respectively. At site C1 there was no evidence of a diel
pattern during the pre-construction phase, but during the construction phase
all four detections occurred during the day. At site C2 there was not a substantial
change in the timing of occurrence of dolphin detections. A weak to moderate diel
trend favoring nighttime detections was present during both phases of the
project.
Finally,
there were significant increases in the ambient noise levels measured at both
sites C1 and C2 during the construction phase (C1: Two-sample T-test, T = 10.7,
p < 0.001; C2: Two-sample T-test, T = 10.5, p < 0.001). At site C1, the
average full-band RMS SPL measured was 105.6dB re 1 �gPa
(S.D. = 2.6) during the pre-construction phase and 108.1dB re 1 �gPa (S.D. = 5.8) during the construction phase. At site C2,
the average full-band RMS SPL measured was 102.8 dB re 1 �gPa
(S.D. = 1.8) during the pre-construction phase and 104.3dB re 1 �gPa (S.D. = 3.3) during the construction phase.
4. DISCUSSION
4.1. Underwater
noise study (dipping hydrophone)
During the 2013 pre-construction phase of the study and
throughout the study area, mean bandlevels of
underwater noise were 116.71 �� 6.29 dB re µPa for the ��wideband�� frequency
range of 30 Hz to 40 kHz and 112.27 �� 6.36 dB re µPa for the
��dolphin-sensitive�� frequency range of 400 Hz to 12.5 kHz. By comparison, mean bandlevels
during the 2014 construction phase of the study and throughout the study area
were 122.80 �� 8.55 dB re 1 µPa for the wideband case and 117.10 �� 8.67 dB re 1
µPa for the dolphin band case.
These average bandlevels were ~5�V6 dB greater
(although within a standard deviation of each other) than those measured during
the baseline phase of the study and are likely attributable to seasonal and/or
annual increases in vessel traffic, some portion of which was
construction-related.
In the vicinity of anticipated bored piling operations,
mean bandlevels were approximately 114 dB re 1 µPa
and 108 dB re 1 µPa for the wideband frequency range and for the
dolphin-sensitive band, respectively, during the baseline phase, that is, a few
decibels quieter than the larger study area. During the construction phase of the
study, mean bandlevels of recordings collected in the
vicinity of bored piling operations and concurrent with construction-related
activities were 125.62 �� 5.80 dB re 1 µPa and 119.31 �� 6.14 dB re 1 µPa for the
wideband frequency range and for the dolphin-sensitive band, respectively. One might conclude that this ~11 dB
increase in bandlevels compared to baseline
measurements is attributable primarily to bored piling noise; however,
measurements collected at varying distances from construction activities and
the weak range-dependence exhibited by propagation models fitted to these
measurements suggest that noise levels near the construction area and
throughout the study area were higher in 2014 compared to 2013 yet were not
strictly the result of bored piling sounds emanating from the bored piling pier
locations. The acoustic records and
observation logs confirm that the soundscape is dominated by transient vessel
noise, some of which was construction-related. In this environment, sounds related to
bored piling activities�Xwith the possible exception of noise generated by
construction-related support ships�Xappears to be negligible compared to other
sound sources, in particular vessel traffic.
In both the baseline and construction phases of the
study, bandlevels far exceeded levels of typical
ocean background ambient noise, whose source is primarily wind/waves and other
environmental factors. Indeed, in
both phases of the study, no correlation was found between wind speed and sound
levels since noise due to vessels and other anthropogenic sources masked that
of wind-generated noise. With
respect to studying local dolphins by passive acoustic methods, these same high
noise levels can also mask dolphin vocalizations and limit their detection
range. Based on propagation
modeling results, vessel noise masks bored piling noise, as well.
In addition to high baseline noise levels, temporal and
spectral characteristics of sound in the study area varied greatly due to the
high density of vessel traffic, fishing-related noise, and other anthropogenic
activity that introduced transient noise throughout the day, especially during
daylight hours.
4.2. Dolphin
acoustic behavioural study (dipping hydrophone)
The information obtained by focal follow hydrophone data
collection yielded some anticipated and also some novel information about the
acoustic activity of Chinese White Dolphins (CWD) in
During the construction phase of the project, the
occurrence of dolphins in
4.3. Passive
acoustic monitoring (EARs)
The EAR data from the pre-construction deployments
indicated that dolphin acoustic activity was considerably greater at site C2
(between Lung Kwu Chau and Sha
Chau) than at C1 (Bridge Alignment Area). On average, 12.8% of files at C2 per
day contained dolphin detections, compared to only 1.6% of files per day at C1.
In addition, the mean number of daily encounters and the duration of encounters
were greater at site C2 than at C1. The day with the greatest number of
detections at C2 was
Dolphin detections at site C1 did not exhibit any
temporal pattern of dolphin occurrence during the pre-construction phase. At
site C2, the main temporal features were the peak in detections occurring in
the morning hours between
The EAR data from the construction-phase period support
the conclusion from the acoustic behavioural study
that a substantial reduction in dolphin occurrence took place during this
period. While a significant decrease in dolphin activity was noted at both
monitoring locations, the change at site C1 (Bridge Alignment Area) was
dramatically greater. The reduction in dolphin acoustic activity and the
proportional change in whistling and clicking at site C2 between project phases
may be explained by seasonal variability. The changes at C1, on the other hand,
are most likely explained by an avoidance of the area by the animals in
response to increased human activity as suggested in Hung (2014).
The drop in noise level in the 2-32 kHz band on 5 October
is somewhat puzzling. A manual spectral analysis of the data recorded before
and after 5 October did not show any evidence of a sudden drop in instrument
sensitivity. In addition, while ambient RMS SPLs were lower, dolphin detections
concurrently increased. This is also inconsistent with the explanation that the
instrument lost sensitivity, because it should have led to fewer dolphin
detections, not more. However, in order to rule out the unlikely possibility of
an instrument malfunction, the two EARs used for this work were compared to one
another in a mock deployment prior to the construction phase of the monitoring
project. The two instruments were co-deployed for a short, 24-hour recording
period in the same location near a boat harbour and
the RMS SPLs of the resulting recordings were calculated. Figure 56 shows
a comparison of the recordings obtained. Only minor differences (~ 2 dB)
consistent with routing instrument variability were observed, indicating that
the EAR from site C1 was functioning properly during the pre-construction
phase. Consequently, a more plausible explanation is that the sources of mid-
(2-16 kHz) and high frequency (16-32 kHz) noise in the area were in some way
removed or suppressed after 5 October. The greatest contributors to shallow
water noise in the 2-32 kHz band are sounds generated from invertebrates
(specifically, snapping shrimp), surface-breaking waves and rain. Therefore,
one or both of the following alternative explanations are plausible: 1) a local
disturbance (e.g. a bottom trawler, large runoff event) substantially
altered/affected the nearby benthic faunal composition, or 2) the days prior to
5 October were characterized by rain and/or surface breaking waves, which were
not present during the remainder of the deployment period. Either or both
events could result in the observed reduction in mid- and high frequency noise.
Exceedances of Action and Limit Levels were recorded for
the monitoring. The following
actions were undertaken in accordance with the Event and Action Plan:
�P
Repeated statistical data analysis to confirm findings with results
presented in the present report;
�P
Reviewed all
available and relevant data to ascertain if differences are as a result of
natural variation or seasonal differences (please refer to the analysis in the
following paragraphs);
�P
Identified
source(s) of impact (please refer to the analysis in the following paragraphs);
�P
Inform
the IEC, SO and Contractor (as reported in the presented report);
�P
Checked
monitoring data with results presented in the present monitoring report;
�P
Carry out
audit to ensure all dolphin protective measures are implemented fully and
additional measures be proposed if necessary (confirmed during weekly site
audits that all measures are implemented); and
�P
Discuss
additional dolphin monitoring and any other potential mitigation measures (e.g.
consider to temporarily stop relevant portion of construction activity) with
the IEC and Contractor (please refer to the discussion below and no immediate
action is considered necessary).
Further details of the Event and Action Plan
implementation are provided below.
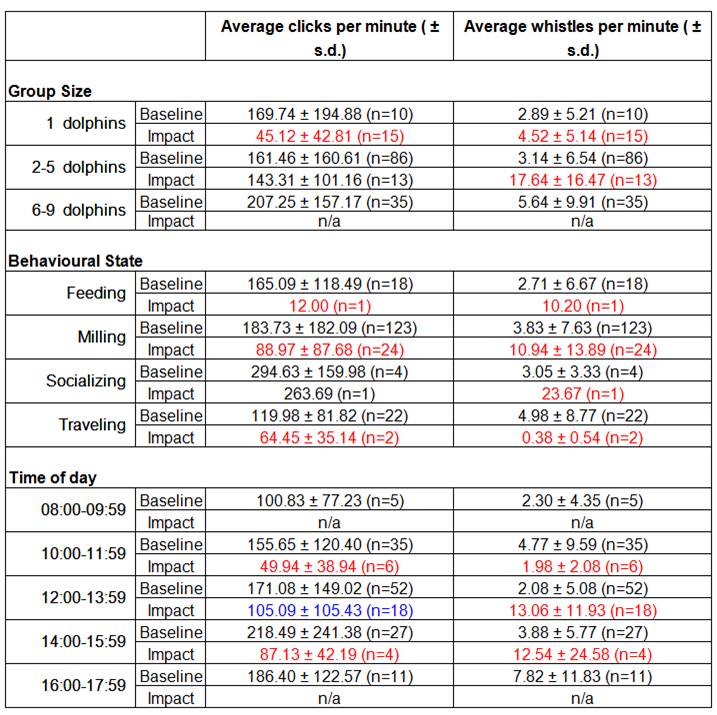
For the implementation of Event and Action Plan, the
values of two response variables (clicking and whistling rates) as a function
of the size of dolphin group, their behavioural state
and time of day deduced from the calibrated hydrophone data are calculated for
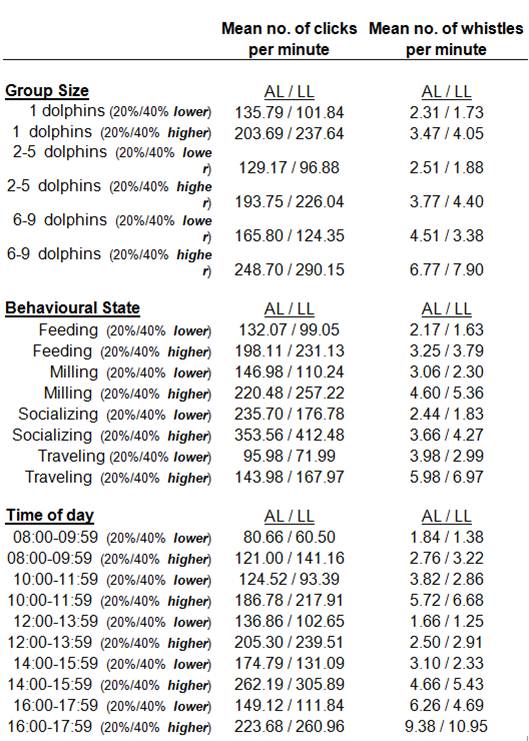
both baseline and impact monitoring periods, and are compared in Table 5. According to the Event and Action Plan shown in Table 6, all response variables described above are taken
in to account, and departures of any of these variables between baseline and
construction phases with a 20% difference will trigger the Action Level under
the EAP. If a 40% difference in any of these variables between baseline and
construction phases is detected, then the Limit Level under the EAP should be
triggered and immediate action will be required (see Table 7).
All variables that have triggered the Action and Limit
Levels are highlighted in Table 5, and differences
between pre-construction and construction phases are noted in the whistle
and/or click production rates of dolphins among several of these variables. In
total, there were one Action Level (AL) exceedance and six Limit Level (LL)
exceedances in the clicking rates, while there were nine LL exceedances in the
whistling rates. However, the small sample size of data obtained during the construction
phase (only 4 encounters with 28 samples) compared to the pre-construction
phase (51 encounters with 131 samples) does not warrant drawing conclusions
based on statistical inference. Therefore, any differences recorded in these
comparisons of whistling and click rates between the two phases of the study
must be viewed with caution, as these may be artifacts of the small sample
sizes obtained during the construction phase.
Another aspect of the Event and Action Plan is to examine
the change of 24-hour pattern of dolphin acoustic activity. If there is a 20% difference in
detections occurred during the nighttime period between
During the construction phase, only four detections were
made at Site C1, and all five were detected outside of the period between
In conclusion, due to the very small sample size recorded
from both the calibrated hydrophone data and EAR data during the construction
phase, it is impossible to determine whether any change in dolphin acoustic behaviour near the construction site was related to the
TM-CLKLK construction activities, and therefore no further action is needed to
be taken.
6. REFERENCES
Brownlee, S.M. and Norris, K.S. 1994. The
acoustic domain. In: Norris, K.S., Würsig, B.,
Wells, R.S., and Würsig, M. The
Hawaiian Spinner Dolphin.
Herzing, D.L. 1996. Vocalizations
and associated underwater behavior of free-ranging
Hung, S. K.
2012. Monitoring of Marine
Mammals in
(2011-12). An unpublished report submitted
to the Agriculture, Fisheries and Conservation Department, 171 pp.
Hung, S. K.
2013. Monitoring of Marine
Mammals in
(2012-13). An unpublished report submitted
to the Agriculture, Fisheries and Conservation Department, 168 pp.
Hung, S. K.
2014. Monitoring of Marine
Mammals in
(2013-14). An unpublished report submitted
to the Agriculture, Fisheries and Conservation Department, 231 pp.
NMFS. 2003. Taking marine mammals
incidental to conducting oil and gas activities in the
Lammers, M. O., Brainard, R. E., Au, W. W. L., Mooney, T. A. and Wong,
K. 2008. An
ecological acoustic recorder (EAR)
for long-term monitoring of biological and anthropogenic sounds on coral reefs
and other marine habitats. Journal
of Acoustical Society of
Piwetz, S.,
Hung, S.K., Wang J.Y., Lundquist, D. and Würsig, B.
2012.
Influence of
vessel traffic on movements of
Indo-Pacific humpback dolphins (Sousa chinensis) off
Sims, P. Q., Vaughn, R., Hung, S. K. and Würsig, B.
2011. Sounds of Indo-Pacific
humpback
dolphins (Sousa chinensis) in
Sims, P., Hung, S. K. and Würsig,
B. 2012. High-speed vessel sounds in
waters and their contributions
relative to Indo-Pacific humpback dolphins (Sousa
chinensis).
Journal of Marine Biology Volume 2012: Article ID 169103, 11 pages (doi: 10.1155/2012/ 169103).
Würsig, B. and
Evans, P. G. H. 2001. Cetaceans and humans: influence of noise. In: Evans, P.
G. H. and Raga, J. A (editors). Marine Mammals: Biology and
Conservation. Kluwer
Academic/Plenum Press,
Würsig, B. and
Greene, C. R., Jr. 2002. Underwater sounds near a fuel receiving
facility in western
Würsig, B.,
Greene, C. R., Jr., and Jefferson, T. A.
2000. Development of an air
bubble curtain
to reduce underwater noise of
percussive piling. Marine
Environmental Research 49: 79-93.
Würsig, B.,
Lynn, S. K., Jefferson, T. A. and Mullin, K. D.
1998. Behavior of cetaceans
in the
northern
Würsig, B. and
Richardson, W. J. 2009. Noise, effects of. In: Perrin, W. F., Würsig, B. and
Thewissen, J. G. M. (editors). The Encyclopedia of Marine Mammals
(second edition). Academic Press,
Würsig, B., Wells, R.S., Norris,
K.S., and Würsig, M. A spinner
dolphin��s day. In: Norris, K.S., Würsig, B.,
Wells, R.S., and Würsig, M. The
Hawaiian Spinner Dolphin.
Table 1. Mean
bandlevels as a function of distance from proposed
bored piling pier locations for the baseline phase of the study.
|
Range (m) |
Mean Bandlevel �� s.d. (dB re 1 µPa) |
|
|
Wideband: 30 Hz �V 40 kHz |
Dolphin Band: 400 Hz �V 12.5 kHz |
|
|
0 |
113.98 ��
3.98 (n=11) |
107.43 ��
4.95 (n=11) |
|
10 |
112.59 ��
2.78 (n=10) |
107.70 ��
2.76 (n=10) |
|
20 |
113.93 ��
3.54 (n=10) |
107.19 ��
4.09 (n=10) |
|
50 |
113.78 ��
4.17 (n=10) |
108.75 ��
5.98 (n=10) |
|
100 |
115.28 ��
4.57 (n=10) |
107.40 ��
4.16 (n=10) |
|
200 |
115.75 ��
3.67 (n=10) |
109.82 ��
5.10 (n=10) |
|
300 |
115.22 ��
4.19 (n=10) |
108.33 ��
4.98 (n=10) |
|
500 |
113.37 ��
3.58 (n=10) |
106.20 ��
2.8 (n=10) |