Contract No. HY/2010/02 �V Hong Kong-Zhuhai-Macao Bridge
Hong Kong Boundary Crossing Facilities �V Reclamation Work (here below, known as
��the Project��) mainly comprises reclamation at the northeast of
the Hong Kong International Airport of
an area of
about 130-hectare for
the construction of an artificial island for the development of the Hong
Kong Boundary Crossing Facilities (HKBCF), and about 19-hectare for the
southern landfall of the Tuen Mun - Chek Lap Kok Link (TMCLKL). It is a
designated project and is governed by the current permits for the Project, i.e.
the amended Environmental Permits (EPs) issued on 06 August 2013 (EP-353/2009/G) and 8 December 2011 (EP-354/2009/A) (for
TMCLKL Southern Landfall Reclamation only).
Ove Arup & Partners Hong Kong Limited (Arup) was
appointed by Highways Department (HyD) as the consultants for the design and
construction assignment for the Project��s reclamation works (i.e. the Engineer
for the Project).
China Harbour Engineering Company Limited (CHEC) was
awarded by HyD as the Contractor to undertake the construction work of the
Project.
ENVIRON Hong Kong Ltd. was employed by HyD as the
Independent Environmental Checker (IEC) and Environmental Project Office (ENPO)
for the Project.
AECOM Asia Co. Ltd. (AECOM) was appointed by CHEC to
undertake the role of Environmental Team for the Project for carrying out the
environmental monitoring and audit (EM&A) works.
The construction phase of the Project under the EPs was
commenced on 12 March 2012 and will be tentatively completed by early Year
2016. The EM&A programme, including air quality, noise, water quality and
dolphin monitoring and environmental site inspections, was commenced on 12
March 2012.
This report documents the findings of EM&A
works conducted in the period between 1 and 30 November 2013. As informed by
the Contractor, major activities in the reporting period were:-
Marine-based
Works
-
Marine-base
-
Cellular structure installation
-
Connecting arc cell installation
-
Laying geo-textile
-
Sand blanket laying
-
Sand filling
-
Maintenance of silt curtain & silt screen at sea water
intake of HKIA
-
Stone column installation
-
Band drain installation
-
Backfill cellular structure
-
Geotechnical Instrumentation works
-
Rubble mound seawall construction
-
Construction of temporary seawall
-
Ground investigation
Land-based
Works
-
Maintenance works of Site Office at Works Area WA2
-
Maintenance works of Public Works Regional Laboratory
at Works Area WA3
-
Geo-textile fabrication at Works Area WA2
-
Installed sand bag at Works Area WA2
-
Silt curtain fabrication at Works Area WA4
-
Maintenance of Temporary Marine Access at Works Area WA2
A summary of monitoring and audit
activities conducted in the reporting period is listed below:
|
24-hour Total Suspended
Particulates (TSP) monitoring
1-hour TSP monitoring
|
5 sessions
5 sessions
|
|
Noise monitoring
|
4 sessions
|
|
Impact water quality
monitoring
|
13 sessions
|
|
Impact dolphin monitoring
|
2 surveys
|
|
Joint Environmental site
inspection
|
4
sessions
|
Breaches
of Action and Limit Levels for Air Quality
All 1-Hour TSP results were below
the Action and Limit Level in the reporting month. Two (2) 24-hour TSP results recorded at AMS3A exceeded the
Action Level and one (1) 24-hour TSP results recorded at AMS3A exceeded the Limit Level in the reporting month. Investigation
results show that the exceedances were not
related to Project.
Breaches
of Action and Limit Levels for Noise
For construction noise, no
exceedance was recorded at all monitoring stations in the reporting period.
Breaches
of Action and Limit Levels for Water Quality ( To be updated)
Fifteen (15) Action Level Exceedances
were recorded at
measured suspended solids (SS) values (in mg/L) in the reporting month. No
Limit Level exceedances
were recorded at measured suspended solids (SS) values (in mg/L) in the
reporting month.
Impact
Dolphin Monitoring
A total
of sixteen dolphin
sightings were recorded during the two surveys, five on 1 November
2013; four on 2 November 2013; six sightings were made on 7 November 2013 and
one sighting was made on 9 November 2013.
Of the sixteen sightings, ten were ��on effort�� (which are all under favourable condition) and six were ��opportunistic��. A total of fifty three individuals were sighted from the
two impact dolphin surveys in the reporting period. Sighting details are
summarised and plotted in Appendix K and Figure 5c, respectively.
Behaviour: Of the sixteen sightings made, five sightings were
recorded as ��multiple�� behavior (four as travelling and
feeding and one as feeding and surface active); eight sightings were recorded as
feeding; one was recorded as travelling and two sightings
were recorded
as ��unknown��. The locations of sighting with different
behaviour are mapped in Figure 5d.
Two action level exceedances were noted and the investigation
and undergoing and results will be reported in the quarterly EM&A report
(Sept 13 �V Nov 13).
Complaint,
Notification of Summons and Successful Prosecution
As
informed by the Contractor on 5 Nov 13, a noise complaint received on 14 Sept 13
was referred to the Contractor of HKBCF on 1 Nov 13. The captioned complaint
invloves noise generated by a tug boat operating near a pier at Tung Chung
around 05:55am-06:45am on 14 Sept 13.
In
respect of the concern incident, the Contractor of HKBCF confirmed that the tug
boat showed in photographs provided does not belong to this project. As a
result, the noise complaint was considered as non-project related
As informed by the Contractor on 5
Dec13, one complaint was noted on 12 Nov regarding a barge moving through the
southern channel.
(Investigation is undergoing as on 6 December 13.)
As informed
by the Contractor, complaint received from Penta-Ocean �V Gitanes Joint Venture
(CV/2012/03) mentioned that the formation works of the Contaminated Mud
Pit CMP1 to the South of the Brothers (CMP1 of SB) which has been
completed in mid-August 2013 and the pit has been commissioned for receiving
contaminated marine mud from other projects starting from 16 August 2013.
However, it was recently observed that some of the project vessels of
HY/2010/02 (photos taken on 20 Nov 2013 are attached) had berthed within the
said pit and those anchorages would likely cause disruption to the underlying contaminated mud and thus
induce unfavourable contamination impact to the surrounding marine environment.
In this regard, they reminded the contractor to avoid berthing of their vessels
within the boundary of CMP1 of SB thereafter for the sake of environmental
concern.
(Investigation is undergoing as on 6 December 13.)
No
notification of summons
and successful
prosecution was received in the reporting period.
Reporting
Change
There was
no reporting change required in the reporting period.
Future Key Issues
Key issues to be
considered in the coming month included:-
-
Site runoff should be properly collected and treated prior
to discharge;
-
Minimize loss of sediment from filling works;
-
Regular review and maintenance of silt curtain systems,
drainage systems and desilting facilities;
-
Exposed surfaces/soil stockpiles should be properly treated
to avoid generation of silty surface run-off during rainstorm;
-
Regular review and maintenance of wheel washing facilities
provided at all site entrances/exits;
-
Conduct regular inspection of various working machineries
and vessels within works areas to avoid any dark smoke emission;
-
Suppress dust generated from work processes with use of
bagged cements, earth movements, excavation activities, exposed surfaces/soil
stockpiles and haul road traffic;
-
Quieter powered mechanical equipment should be used;
-
Provision of proper and effective noise control measures for
operating equipment and machinery on-site, such as erection of movable noise
barriers or enclosure for noisy plants;
-
Closely check and replace the sound insulation materials
regularly;
-
Better scheduling of construction works to minimize noise
nuisance;
-
Properly store and label oil drums and chemical containers
placed on site;
-
Proper chemicals, chemical wastes and wastes management;
-
Maintenance works should be carried out within roofed, paved
and confined areas;
-
Collection and segregation of construction waste and general
refuse on land and in the sea should be carried out properly and regularly; and
-
Proper protection and regular inspection of existing trees,
transplanted/retained trees.
1.1.1
Contract
No. HY/2010/02 �V Hong Kong-Zhuhai-Macao Bridge Hong Kong Boundary Crossing
Facilities �V Reclamation Work (here below, known as ��the Project��) mainly
comprises reclamation at the northeast
of the Hong Kong International Airport of
an area of
about 130-hectare for
the construction of an artificial island for the development of the Hong
Kong Boundary Crossing Facilities (HKBCF), and about 19-hectare for the
southern landfall of the Tuen Mun - Chek Lap Kok Link (TMCLKL).
1.1.2
The environmental impact assessment (EIA) reports (Hong Kong �V
Zhuhai �V Macao Bridge Hong Kong Boundary Crossing
Facilities �V EIA Report (Register No. AEIAR-145/2009) (HKBCFEIA) and Tuen Mun �V
Chek Lap Kok Link �V EIA Report (Register No. AEIAR-146/2009) (TMCLKLEIA), and
their environmental monitoring and audit (EM&A) Manuals (original EM&A
Manuals), for the Project were approved by Environmental Protection Department
(EPD) in October 2009.
1.1.3
EPD subsequently issued the
Environmental Permit (EP) for HKBCF in November 2009
(EP-353/2009) and the Variation of Environmental Permit (VEP) in June 2010
(EP-353/2009/A), November 2010 (EP-353/2009/B), November 2011 (EP-353/2009/C), March 2012
(EP-353/2009/D), October 2012 (EP-353/2009/E),
April 2013 (EP-353/2009/F)
and August 2013 (EP-353/2009/G).
Similarly, EPD issued the Environmental Permit (EP) for TMCLKL in November 2009
(EP-354/2009) and the Variation of Environmental Permit (VEP) in December 2010 (EP-354/2009/A).
1.1.4
The Project
is a designated project and is governed by the current permits for the Project,
i.e. the amended EPs issued on 6 August 2013 (EP-353/2009/G) and 8 December 2011 (EP-354/2009/A) (for
TMCLKL Southern Landfall Reclamation only).
1.1.5
A Project
Specific EM&A Manual, which included all project-relation contents from the
original EM&A Manuals for the Project, was issued in May 2012.
1.1.6
Ove Arup
& Partners Hong Kong Limited (Arup) was appointed by Highways Department
(HyD) as the consultants for the design and construction assignment for the
Project��s reclamation works (i.e. the Engineer for the Project).
1.1.7
China
Harbour Engineering Company Limited (CHEC) was awarded by HyD as the Contractor
to undertake the construction work of the Project.
1.1.8
ENVIRON
Hong Kong Ltd. was employed by HyD as the Independent Environmental Checker
(IEC) and Environmental Project Office (ENPO) for the Project.
1.1.9
AECOM Asia
Co. Ltd. (AECOM) was appointed by CHEC to undertake the role of Environmental
Team for the Project for carrying out the EM&A works.
1.1.10
The
construction phase of the Project under the EPs was commenced on 12 March 2012
and will be tentatively completed by early Year 2016.
1.1.11
According
to the Project Specific EM&A Manual, there is a need of an EM&A
programme including air quality, noise, water quality and dolphin monitoring
and environmental site inspections. The EM&A programme of the Project
commenced on 12 March 2012.
1.2
Scope of Report
1.2.1
This is the
twentieth
monthly EM&A Report under the Contract No.HY/2010/02 Hong Kong-Zhuhai-Macao
Bridge Hong Kong Boundary Crossing Facilities �V Reclamation Works. This report
presents a summary of the environmental monitoring and audit works, list of
activities and mitigation measures proposed by the ET for the Project in November 2013.
1.3.1 The project organization structure is shown in
Appendix A. The key personnel contact names and numbers are summarized in Table
1.1.
Table 1.1 Contact
Information of Key Personnel
|
Party
|
Position
|
Name
|
Telephone
|
Fax
|
|
Engineer��s
Representative (ER)
(Ove Arup & Partners Hong Kong Limited)
|
Chief Resident Engineer
|
Roger Marechal
|
3698 5700
|
2698 5999
|
|
IEC / ENPO
(ENVIRON Hong Kong
Limited)
|
Independent Environmental
Checker
|
Raymond Dai
|
3465 2868
|
3465 2899
|
|
Environmental Project Office
Leader
|
Y. H. Hui
|
3465 2868
|
3465 2899
|
|
Contractor
(China Harbour
Engineering Company Limited)
|
General Manager (S&E)
|
Daniel Leung
|
3157 1086
|
2578 0413
|
|
Environmental Officer
|
Richard Ng
|
36932253
|
2578 0413
|
|
24-hour Hotline
|
Alan C.C. Yeung
|
9448 0325
|
--
|
|
ET
(AECOM Asia Company Limited)
|
ET Leader
|
Echo Leong
|
3922 9280
|
2317 7609
|
1.4.1 The construction
phase of the Project under the EP commenced on 12 March 2012.
1.4.2 As informed by the
Contractor, details of the major works carried out in this reporting period are
listed below:-
Marine-based Works
-
Marine-base
-
Cellular structure installation
-
Connecting arc cell installation
-
Laying geo-textile
-
Sand blanket laying
-
Sand filling
-
Maintenance of silt curtain & silt screen at sea water
intake of HKIA
-
Stone column installation
-
Band drain installation
-
Backfill cellular structure
-
Geotechnical Instrumentation works
-
Rubble mound seawall construction
-
Construction of temporary seawall
-
Ground investigation
Land-based Works
-
Maintenance works of Site Office at Works Area WA2
-
Maintenance works of Public Works Regional Laboratory
at Works Area WA3
-
Geo-textile fabrication at Works Area WA2
-
Installed sand bag at Works Area WA2
-
Silt curtain fabrication at Works Area WA4
-
Maintenance of Temporary Marine Access at Works Area WA2
1.4.3 The 3-month rolling
construction programme of the Project is shown in Appendix B.
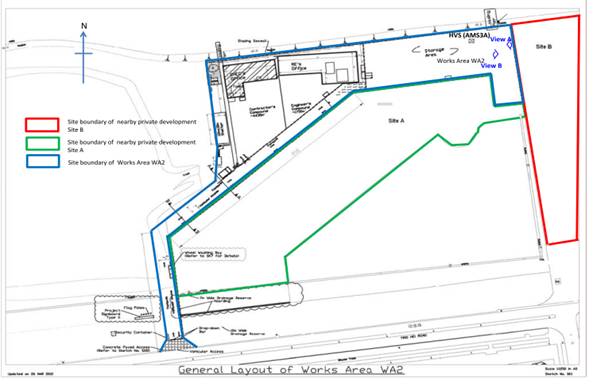
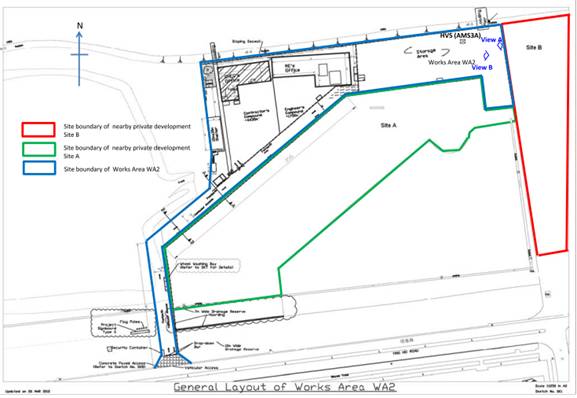
1.4.4 The general layout
plan of the Project site showing the detailed works areas is shown in Figure 1.
1.4.5 The environmental
mitigation measures implementation schedule are presented in Appendix C.
1.5.1
The EM&A programme required environmental monitoring for air
quality, noise, water quality, marine ecology and environmental site
inspections for air quality, noise, water quality, waste management, marine
ecology, and landscape and visual impact. The EM&A requirements for each
parameter described in the following sections include:-
-
All monitoring
parameters;
-
Monitoring
schedules for the reporting month and forthcoming month;
-
Action and
Limit levels for all environmental parameters;
-
Event / Action
Plan;
-
Environmental mitigation
measures, as recommended in the Project EIA reports; and
-
Environmental
requirement in contract documents.
2.1.1 In accordance with
the Project Specific EM&A Manual, baseline 1-hour and 24-hour Total
Suspended Particulates (TSP) levels at 4 air quality monitoring stations were
established. Impact 1-hour TSP monitoring was conducted for at least three
times every 6 days, while impact 24-hour TSP monitoring was carried out for at
least once every 6 days. The Action and Limit level of the air quality
monitoring is provided in Appendix D.
2.2.1 24-hour TSP air
quality monitoring was performed using High Volume Sampler (HVS) located at
each designated monitoring station. The HVS meets all the requirements of the
Project Specific EM&A Manual.
Portable direct reading dust meters were used to carry out the 1-hour
TSP monitoring. Brand and model of
the equipment is given in Table 2.1.
Table
2.1 Air Quality Monitoring Equipment
|
Equipment
|
Brand and Model
|
|
Portable
direct reading dust meter (1-hour TSP)
|
Sibata
Digital Dust Monitor (Model No. LD-3 and
LD-3B)
|
|
High
Volume Sampler
(24-hour TSP)
|
Tisch
Environmental Mass Flow Controlled Total Suspended Particulate (TSP) High
Volume Air Sampler
(Model
No. TE-5170)
|
2.3
Monitoring
Locations
2.3.1 Monitoring locations
AMS2 and AMS7 were set up at the proposed locations in accordance with Project
Specific EM&A Manual. For AMS6 (Dragonair/CNAC (Group) Building),
permission on setting up and carrying out impact monitoring works was sought,
however, access to the premise has not been granted yet on this report issuing
date. For monitoring location AMS3 (Ho Yu College), as proposed in the Project
Specific EM&A Manual, approval for carrying out impact monitoring could not
be obtained from the principal of the school. Permission on setting up and
carrying out impact monitoring works at nearby sensitive receivers, like
Caribbean Coast and Coastal Skyline, was also sought. However, approvals for carrying out
impact monitoring works within their premises were not obtained. Impact air
quality monitoring was conducted at site boundary of the site office area in
Works Area WA2 (AMS3A) respectively. Same baseline and Action Level for air
quality, as derived from the baseline monitoring data recorded at Ho Yu
College, was adopted for this alternative air quality location.
2.3.2 Reference is made to
ET��s proposal of the omission of air monitoring
station (AMS 6) dated on 1 November 2012
and EPD��s
letter dated on 19 November 2012 regarding the conditional approval of the proposed omission of air monitoring station (AMS 6) for
Contract No. HY/2010/02. The aforesaid omission of Monitoring Station AMS6 is effective since 19 November 2012.
2.3.3 Figure 2 shows the
locations of monitoring stations. Table 2.2 describes the details of the
monitoring stations.
Table
2.2 Locations
of Impact Air Quality Monitoring Stations
|
Monitoring Station
|
Location
|
Description
|
|
AMS2
|
Tung Chung
Development Pier
|
Rooftop of the premise
|
|
AMS3A
|
Site Boundary of Site Office
Area at Works Area WA2
|
On ground at the area boundary
|
|
AMS6*
|
Dragonair/CNAC (Group) Building
|
On ground at boundary of the premise
|
|
AMS7
|
Hong Kong SkyCity
Marriott Hotel
|
On ground at boundary of the premise
|
#Remarks: Reference is made to EPD
conditional approval of the omission of air monitoring station (AMS 6) for the
project. The omission will be effective on 19 November 2012.
2.4
Monitoring
Parameters, Frequency and Duration
2.4.1 Table 2.3 summarizes
the monitoring parameters, frequency and duration of impact TSP monitoring.
Table
2.3 Air
Quality Monitoring Parameters, Frequency and Duration
|
Parameter
|
Frequency and Duration
|
|
1-hour
TSP
|
Three times every 6
days while the highest dust impact was expected
|
|
24-hour
TSP
|
Once every 6 days
|
2.5
Monitoring Methodology
2.5.1 24-hour TSP
Monitoring
(a)
The HVS was installed in the
vicinity of the air sensitive receivers.
The following criteria were considered in the installation of the HVS.
(i)
A horizontal platform with
appropriate support to secure the sampler against gusty wind was provided.
(ii)
No two samplers should be placed
less than 2 meters apart.
(iii)
The distance between the HVS and
any obstacles, such as buildings, was at least twice the height that the
obstacle protrudes above the HVS.
(iv)
A minimum of 2 meters separation
from walls, parapets and penthouse for rooftop sampler.
(v)
A minimum of 2 meters separation from
any supporting structure, measured horizontally is required.
(vi)
No furnace or incinerator flues
nearby.
(vii)
Airflow around the sampler was
unrestricted.
(viii)
Permission was obtained to set up
the samplers and access to the monitoring stations.
(ix)
A secured supply of electricity
was obtained to operate the samplers.
(x)
The sampler was located more than
20 meters from any dripline.
(xi)
Any wire fence and gate, required
to protect the sampler, did not obstruct the monitoring process.
(xii)
Flow control accuracy was kept
within ��2.5% deviation over 24-hour sampling period.
(b)
Preparation of Filter Papers
(i)
Glass fibre filters, G810 were
labelled and sufficient filters that were clean and without pinholes were
selected.
(ii)
All filters were equilibrated in
the conditioning environment for 24 hours before weighing. The conditioning
environment temperature was around 25 �XC
and not variable by more than ��3 �XC;
the relative humidity (RH) was < 50% and not variable by more than ��5%. A
convenient working RH was 40%.
(iii)
All filter papers were prepared and
analysed by ALS Technichem (HK) Pty Ltd., which is a HOKLAS accredited
laboratory and has comprehensive quality assurance and quality control
programmes.
(c)
Field Monitoring
(i)
The power supply was checked to
ensure the HVS works properly.
(ii)
The filter holder and the area
surrounding the filter were cleaned.
(iii)
The filter holder was removed by
loosening the four bolts and a new filter, with stamped number upward, on a
supporting screen was aligned carefully.
(iv)
The filter was properly aligned
on the screen so that the gasket formed an airtight seal on the outer edges of
the filter.
(v)
The swing bolts were fastened to
hold the filter holder down to the frame.
The pressure applied was sufficient to avoid air leakage at the edges.
(vi)
Then the shelter lid was closed
and was secured with the aluminum strip.
(vii)
The HVS was warmed-up for about 5
minutes to establish run-temperature conditions.
(viii)
A new flow rate record sheet was
set into the flow recorder.
(ix)
On site temperature and atmospheric
pressure readings were taken and the flow rate of the HVS was checked and
adjusted at around 1.1 m3/min, and complied with the range specified
in the updated EM&A Manual (i.e. 0.6-1.7 m3/min).
(x)
The programmable digital timer
was set for a sampling period of 24 hrs, and the starting time, weather
condition and the filter number were recorded.
(xi)
The initial elapsed time was
recorded.
(xii)
At the end of sampling, on site
temperature and atmospheric pressure readings were taken and the final flow
rate of the HVS was checked and recorded.
(xiii)
The final elapsed time was
recorded.
(xiv)
The sampled filter was removed
carefully and folded in half length so that only surfaces with collected
particulate matter were in contact.
(xv)
It was then placed in a clean
plastic envelope and sealed.
(xvi)
All monitoring information was
recorded on a standard data sheet.
(xvii)
Filters were then sent to ALS
Technichem (HK) Pty Ltd. for analysis.
(d)
Maintenance and Calibration
(i)
The HVS and its accessories were
maintained in good working condition, such as replacing motor brushes routinely
and checking electrical wiring to ensure a continuous power supply.
(ii)
5-point calibration of the HVS
was conducted using TE-5025A
Calibration Kit prior to the commencement of baseline monitoring. Bi-monthly
5-point calibration of the HVS will be carried out during impact monitoring.
(iii)
Calibration certificate of the
HVSs are provided in Appendix E.
2.5.2 1-hour TSP Monitoring
(a)
Measuring Procedures
The
measuring procedures of the 1-hour dust meter were in accordance with the
Manufacturer��s Instruction Manual as follows:-
(i)
Turn the power on.
(ii)
Close the air collecting opening
cover.
(iii)
Push the ��TIME SETTING�� switch to
[BG].
(iv)
Push ��START/STOP�� switch to
perform background measurement for 6 seconds.
(v)
Turn the knob at SENSI ADJ position
to insert the light scattering plate.
(vi)
Leave the equipment for 1 minute
upon ��SPAN CHECK�� is indicated in the display.
(vii)
Push ��START/STOP�� switch to
perform automatic sensitivity adjustment. This measurement takes 1 minute.
(viii)
Pull out the knob and return it
to MEASURE position.
(ix)
Push the ��TIME SETTING�� switch
the time set in the display to 3 hours.
(x)
Lower down the air collection
opening cover.
(xi)
Push ��START/STOP�� switch to start
measurement.
(b)
Maintenance and Calibration
(i)
The 1-hour TSP meter was
calibrated at 1-year intervals against a continuous particulate TEOM Monitor,
Series 1400ab. Calibration certificates of the Laser Dust Monitors are provided
in Appendix E.
(ii)
1-hour validation checking of the
TSP meter against HVS is carried out on half-year basis at the air quality monitoring locations.
2.6
Monitoring
Schedule for the Reporting Month
2.6.1
The schedule for air quality monitoring in November 2013 is provided in Appendix F.
2.7
Results and
Observations
2.7.1 The monitoring
results for 1-hour TSP and 24-hour TSP are summarized in Table 2.4 and 2.5
respectively. Detailed impact air quality monitoring results are presented in
Appendix G.
Table
2.4 Summary
of 1-hour TSP Monitoring Results in the Reporting Period
|
|
Average (mg/m3)
|
Range (mg/m3)
|
Action
Level (mg/m3)
|
Limit Level
(mg/m3)
|
|
AMS2
|
84
|
78 �V 88
|
374
|
500
|
|
AMS3A
|
84
|
80 �V 87
|
368
|
500
|
|
AMS7
|
84
|
77 �V 88
|
370
|
500
|
Table
2.5 Summary
of 24-hour TSP Monitoring Results in the Reporting Period
|
|
Average (mg/m3)
|
Range (mg/m3)
|
Action Level
(mg/m3)
|
Limit Level
(mg/m3)
|
|
AMS2
|
86
|
56 �V 86
|
176
|
260
|
|
AMS3A
|
235
|
83 �V 518
|
167
|
260
|
|
AMS7
|
76
|
57 �V 118
|
183
|
260
|
2.7.2 The major dust source
in the reporting period included construction activities from the Project, construction
activities by other contacts, as well as nearby traffic emissions.
2.7.3 All 1-hour TSP results were below the Action and Limit Level at all monitoring locations in the
reporting month. Two (2) 24-hour TSP results recorded at AMS3A exceeded the
Action Level and one (1) 24-hour TSP results recorded at AMS3A exceeded the Limit Level in the reporting month. Investigation results show that
the exceedance was not related to Project.
2.7.4 For the 24Hr TSP
Action Level exceedance recorded at AMS3A, a result of 221mg/m3 was recorded on 12 Nov 13 (24-hr TSP).
2.7.4.1 According
to information provided by the Contractor, land-based construction activity
such as installation of sand bags, transloading band drain material and
sampling for Type 2 geotextile were being undertaken at Works Area WA2 during
the monitoring period.
2.7.4.2 Functional
checking on HVS at AMS3A was done. Air flow of the HVS was checked and the flow
was steady during the 24-hr TSP sampling at AMS3A. The filter paper was re-weighted
by the assigned HOKLAS laboratory and the result was reconfirmed.
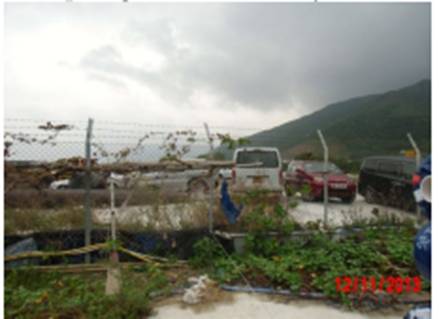
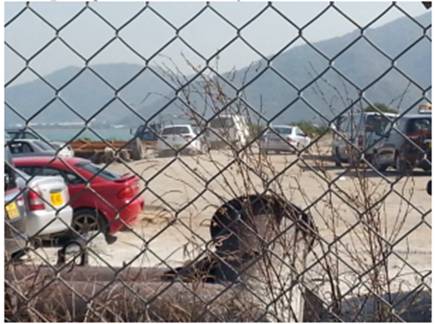
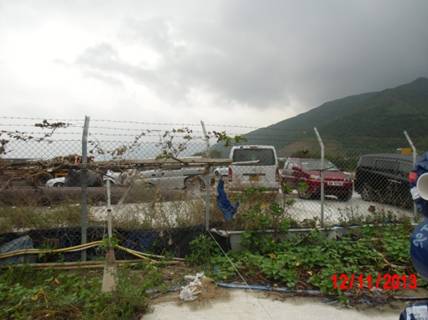
2.7.4.3 Photo
records shows vehicle parking activities were observed inside an area at
construction sites of nearby private development project which are close to the
monitoring station AMS3A but beyond the site boundary of Works Area WA2.
(Please also see photo and layout map attached for reference of site conditions
(View A.))
2.7.4.4 As
refer to the wind data collected at wind station at Works Area WA2 during the
monitoring period on 11 and 12 Nov 13 (as attached) southeast winds was
prevailing during the monitoring period. Traffic activities at construction
sites of nearby private development project which are close to the monitoring
station AMS3A but beyond the site boundary of Works Area WA 2 may contribute to
the measured dust levels at the monitoring station AMS3A.
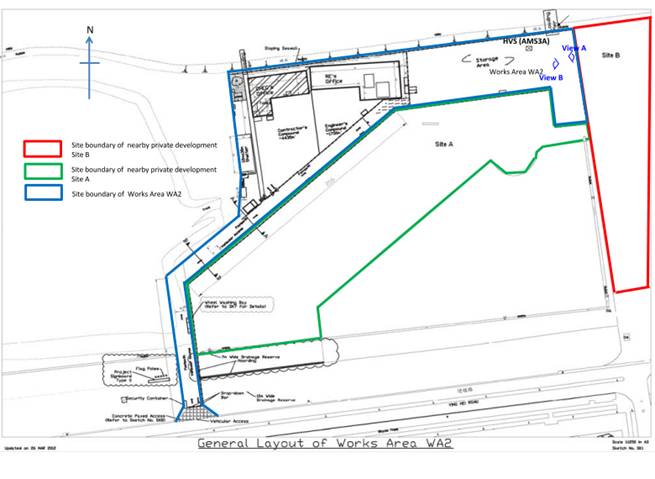
Conditions
of the construction sites near Works Area WA2:
View A: (Parking lot observed at nearby construction site which do not belongs to
this Contract):
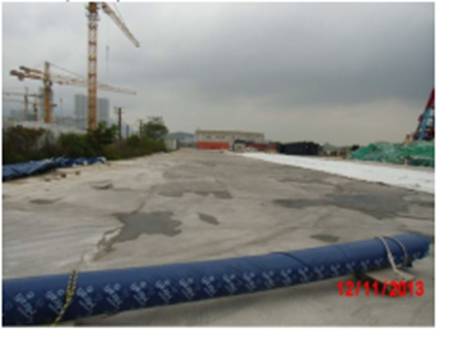
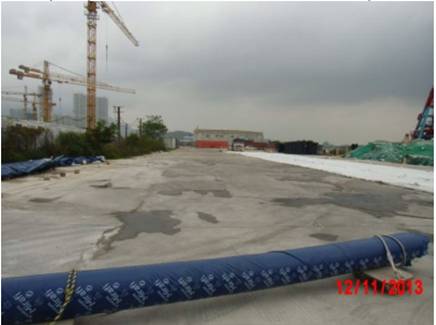
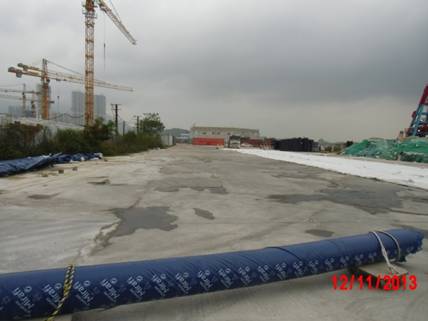
View B (Hard paved surface
observed at Works Area WA2)
2.7.4.5 The
1-hr TSP values recorded at AMS3A on 12 Nov 13, which are within the monitoring
period of the 24-hr TSP, were 86�gg/m3, 87�gg/m3 and 86�gg/m3 respectively. All
measured values are well below the Action and Limit Levels.
2.7.4.6 The
measured 24-hr TSP values recorded at AMS2 and AMS7 (which are closer to the
marine-based works areas) on the same monitoring date were 60�gg/m3 and 57�gg/m3
respectively, which are below the Action and Limit Levels.
2.7.4.7 The
following dust mitigation measures have been implemented at Works Area WA2:
1.
Works Area WA2��s surface was hard-paved, compacted or
hydro-seeded (Please refer to attached layout map and photo record (View B))
2.
Vehicle washing facility was provided at vehicle exit
points,
3.
Measures for preventing fugitive dust emission are provided,
e.g. canvas/tarpaulin covers.
2.7.4.8 The
dust exceedance was therefore considered not to be due to the Project works.
2.7.4.9 The
Contractor was recommended to continue implementing existing dust mitigation
measures.
2.7.5 For the 24Hr TSP
Action Level exceedance recorded at AMS3A, a result of 244mg/m3 was recorded on 18 Nov 13 (24-hr TSP).
2.7.5.1
According to information provided by the Contractor, land-based
construction activity such as installation of sand bags and stitching Type 2
geotextile were being undertaken at Works Area WA2 during the monitoring
period.
2.7.5.2
Functional checking on HVS at AMS3A was done. Air flow of the HVS was
checked and the flow was steady during the 24-hr TSP sampling at AMS3A. The
filter paper was re-weighted by the assigned HOKLAS laboratory and the result
was reconfirmed.
2.7.5.3
Photo records shows vehicle parking activities were observed inside an
area at construction sites of nearby private development project which are
close to the monitoring station AMS3A but beyond the site boundary of Works
Area WA2. (Please also see photo and layout map attached for reference of site
conditions (View A.))
Photo
record:
View A (parking lot
observed at nearby construction site which do not belongs to this Contract)
View B (Hard paved surface observed at
Works Area WA2)
2.7.5.4
As refer to the wind data collected at wind station at Works Area WA2
during the monitoring period on 18 and 19 Nov 13 (as attached) southeast winds
was prevailing during the monitoring period. Traffic activities at construction
sites of nearby private development project which are close to the monitoring
station AMS3A but beyond the site boundary of Works Area WA 2 may contribute to
the measured dust levels at the monitoring station AMS3A.
2.7.5.5
The 1-hr TSP values recorded at AMS3A on 18 Nov 13, which are within the
monitoring period of the 24-hr TSP, were 84�gg/m3, 84�gg/m3 and 86�gg/m3
respectively. All measured values are well below the Action and Limit Levels.
2.7.5.6
The measured 24-hr TSP values recorded at AMS2 and AMS7 (which are
closer to the marine-based works areas) on the same monitoring date were
125�gg/m3 and 118�gg/m3 respectively, which are below the Action and Limit
Levels.
2.7.5.7
The following dust mitigation measures have been implemented at Works
Area WA2:
1.
Works Area WA2��s surface was hard-paved, compacted or
hydro-seeded (Please refer to attached layout map and photo record (View B))
2.
Vehicle washing facility was provided at vehicle exit
points,
3.
Measures for preventing fugitive dust emission are provided,
e.g. canvas/tarpaulin covers.
2.7.5.8
The dust exceedance was therefore considered not to be due to the
Project works.
2.7.5.9
The Contractor was recommended to continue implementing existing dust
mitigation measures.
2.7.6
For the 24Hr TSP Action Level exceedance recorded at AMS3A, a result of 518�gg/m3 was recorded on 23 Nov 13 (24-hr TSP).
2.7.6.1
According to information provided by the Contractor, land-based
construction activity such as installation of sand bags, transloading band
drain material and sampling for Type 2 geotextile were being undertaken at
Works Area WA2 during the monitoring period.
2.7.6.2
Functional checking on HVS at AMS3A was done. Air flow of the HVS was
checked and the flow was steady during the 24-hr TSP sampling at AMS3A. The
filter paper was re-weighted by the assigned HOKLAS laboratory and the result
was reconfirmed.
2.7.6.3
Photo records shows
vehicle parking activities were observed inside an area at construction sites
of nearby private development project which are close to the monitoring station
AMS3A but beyond the site boundary of Works Area WA2. (Please also see photo
and layout map attached for reference of site conditions (View A.))
Photo
record:
View A (parking lot observed at nearby
construction site which do not belongs to this Contract)
View B (Hard paved surface observed at Works
Area WA2)
2.7.6.4
As refer to the wind data collected at wind station at Works Area WA2
during the monitoring period on 22 and 23 Nov 13 (as
attached) southeast winds was prevailing during the monitoring period. Traffic
activities at construction sites of nearby private development project which
are close to the monitoring station AMS3A but beyond the site boundary of Works
Area WA 2 may contribute to the measured dust levels at the monitoring station
AMS3A.
2.7.6.5
The 1-hr TSP values recorded at AMS3A on 23 Nov 13,
which are within the monitoring period of the 24-hr TSP, were 86�gg/m3, 87�gg/m3
and 86�gg/m3 respectively. All measured values are well below the Action and
Limit Levels.
2.7.6.6
The measured 24-hr TSP values recorded at AMS2 and AMS7 (which are
closer to the marine-based works areas) on the same monitoring date were
60�gg/m3 and 57�gg/m3 respectively, which are below the Action and Limit Levels.
2.7.6.7
The following dust mitigation measures have been implemented at Works Area
WA2:
1.
Works Area WA2��s surface was hard-paved, compacted or
hydro-seeded (Please refer to attached layout map and photo record (View B))
2.
Vehicle washing facility was provided at vehicle exit
points,
3.
Measures for preventing fugitive dust emission are provided,
e.g. canvas/tarpaulin covers.
2.7.6.8
The dust exceedance was therefore considered not to be due to the
Project works.
2.7.6.9
The Contractor was recommended to continue implementing existing dust
mitigation measures.
2.7.7 The event action plan
is annexed in Appendix L.
2.7.8 Meteorological
information collected from the wind station during the monitoring periods on
the monitoring dates, as shown in Figure 2, including wind speed and wind
direction, is annexed in Appendix H.
3.1.1 In accordance with
the Project Specific EM&A Manual, impact noise monitoring was conducted for
at least once per week during the construction phase of the Project. The Action
and Limit level of the noise monitoring is provided in Appendix D.
3.2
Monitoring
Equipment
3.2.1 Noise monitoring was
performed using sound level meter at each designated monitoring station. The sound level meters deployed comply
with the International Electrotechnical Commission Publications (IEC) 651:1979
(Type 1) and 804:1985 (Type 1) specifications. Acoustic calibrator was deployed to
check the sound level meters at a known sound pressure level. Brand and model of the equipment is given
in Table 3.1.
Table 3.1 Noise
Monitoring Equipment
|
Equipment
|
Brand and Model
|
|
Integrated Sound Level Meter
|
Rion NL-31
& B&K2238
|
|
Acoustic Calibrator
|
Rion NC-73
|
3.3
Monitoring
Locations
3.3.1 Monitoring locations
NMS2 was set up at the proposed locations in accordance with Project Specific
EM&A Manual. However, for monitoring location NMS3 (Ho Yu College), as
proposed in the Project Specific EM&A Manual, approval for carrying out
impact monitoring could not be obtained from the principal of the school.
Permission on setting up and carrying out impact monitoring works at nearby
sensitive receivers, like Caribbean Coast and Coastal Skyline, was also
sought. However, approvals for
carrying out impact monitoring works within their premises were not obtained.
Impact noise monitoring was conducted at site boundary of the site office area
in Works Area WA2 (NMS3A) respectively. Same baseline noise level (as derived
from the baseline monitoring data recorded at Ho Yu College) and Limit Level
were adopted for this alternative noise monitoring location.
3.3.2 Figure 2 shows the
locations of the monitoring stations. Table 3.2 describes the details of the
monitoring stations.
Table 3.2 Locations
of Impact Noise Monitoring Stations
|
Monitoring Station
|
Location
|
Description
|
|
NMS2
|
Seaview Crescent Tower 1
|
Free-field
on the rooftop of the premise
|
|
NMS3A
|
Site Boundary of Site Office Area at
Works Area WA2
|
Free-field on
ground at the area boundary.
|
3.4.1
Table 3.3 summarizes the monitoring parameters, frequency and duration
of impact noise monitoring.
Table
3.3 Noise
Monitoring Parameters, Frequency and Duration
|
Parameter
|
Frequency and Duration
|
|
30-mins measurement at each monitoring station between
0700 and 1900 on normal weekdays (Monday to Saturday). Leq, L10
and L90 would be recorded.
|
At least once per week
|
3.5.1 Monitoring Procedure
(a)
The sound level meter was set on
a tripod at a height of 1.2 m
above the ground for free-field measurements at NMS2. A correction of +3 dB(A)
shall be made to the free field measurements.
(b)
All
measurement at NMS3A were free field measurements in the reporting month at NMS3A. A correction of +3 dB(A) shall be made to the free field measurements.
(c)
The battery condition was checked
to ensure the correct functioning of the meter.
(d)
Parameters such as frequency
weighting, the time weighting and the measurement time were set as follows:-
(i)
frequency weighting: A
(ii)
time weighting: Fast
(iii)
time measurement: Leq(30-minutes)
during non-restricted hours i.e. 07:00 �V 1900 on normal weekdays.
(e)
Prior to and after each noise
measurement, the meter was calibrated using the acoustic calibrator for 94dB(A)
at 1000 Hz. If the difference in
the calibration level before and after measurement was more than 1 dB(A), the
measurement would be considered invalid and repeat of noise measurement would
be required after re-calibration or repair of the equipment.
(f)
During the monitoring period, the
Leq, L10 and L90 were recorded. In addition, site conditions and noise
sources were recorded on a standard record sheet.
(g)
Noise measurement was paused
during periods of high intrusive noise (e.g. dog barking, helicopter noise) if
possible. Observations were recorded when intrusive noise was unavoidable.
(h)
Noise monitoring was cancelled in
the presence of fog, rain, wind with a steady speed exceeding 5m/s, or wind with gusts exceeding 10m/s. The wind speed shall be checked with a portable wind speed
meter capable of measuring the wind speed in m/s.
3.5.2 Maintenance and
Calibration
(a)
The microphone head of the sound
level meter was cleaned with soft cloth at regular intervals.
(b)
The meter and calibrator were sent
to the supplier or HOKLAS laboratory to check and calibrate at yearly
intervals.
(c)
Calibration certificates of the
sound level meters and acoustic calibrators are provided in Appendix E.
3.6.1 The schedule for
construction noise monitoring in November 2013 is provided in
Appendix F.
3.7.1 The monitoring
results for construction noise are summarized in Table 3.4 and the monitoring
data is provided in Appendix I.
Table
3.4 Summary
of Construction Noise Monitoring Results in the Reporting Period
|
|
Average,
dB(A),
Leq (30 mins)
|
Range,
dB(A),
Leq (30 mins)
|
Limit Level,
dB(A),
Leq (30 mins)
|
|
NMS2
|
66
|
64 �V 68*
|
75
|
|
NMS3A
|
65
|
64 �V 66*
|
70^
|
*+3dB(A) Façade
correction included
^
Daytime noise Limit Level of 70 dB(A)
applies to education institutions, while 65dB(A) applies during school
examination period.
3.7.2 No Action or Limit Level Exceedance of construction noise was recorded in the
reporting month.
3.7.3 Major noise sources
during the noise monitoring included construction activities of the Project,
construction activities by other contracts and nearby traffic noise.
3.7.4 The event action plan
is annexed in Appendix L.
4
WATER QUALITY MONITORING
4.1
Monitoring
Requirements
4.1.1 Impact water quality
monitoring was carried out to ensure that any deterioration of water quality
was detected, and that timely action was taken to rectify the situation. For impact water quality monitoring, measurements
were taken in accordance with the Project Specific EM&A Manual. Appendix D
shows the established Action/Limit Levels for the environmental monitoring
works.
4.2.1 Table 4.1 summarises
the equipment used in the impact water quality monitoring programme.
Table 4.1 Water
Quality Monitoring Equipment
|
Equipment
|
Brand and Model
|
|
Dissolved Oxygen (DO) and Temperature Meter, Salinity Meter and
Turbidimeter
|
YSI Model 6820
|
|
pH Meter
|
YSI Model 6820 or Thermo Orion 230A+
|
|
Positioning Equipment
|
JRC DGPS 224 Model JLR-4341 with J-NAV 500 Model NWZ4551
|
|
Water Depth Detector
|
Eagle Cuda-168
|
|
Water Sampler
|
Kahlsio Water Sampler (Vertical) 2.2 L with messenger
|
4.3.1
Table 4.2 summarises the monitoring parameters, frequency and monitoring
depths of impact water quality monitoring as required in the Project Specific
EM&A Manual.
Table
4.2 Impact
Water Quality Monitoring Parameters and Frequency
|
Monitoring
Stations
|
Parameter,
unit
|
Frequency
|
No.
of depth
|
|
Impact
Stations:
IS5, IS(Mf)6, IS7, IS8,
IS(Mf)9, IS10, IS(Mf)11, IS(Mf)16, IS17
Control/Far
Field Stations:
CS(Mf)3, CS(Mf)5, CS4, CS6,
CSA
Sensitive
Receiver Stations:
SR3-SR7, SR10A&SR10B
|
�P
Depth, m
�P
Temperature, oC
�P
Salinity, ppt
�P
Dissolved Oxygen (DO), mg/L
�P
DO Saturation, %
�P
Turbidity, NTU
�P
pH
�P
Suspended Solids (SS), mg/L
|
Three
times per week during mid-ebb and mid-flood tides (within �� 1.75 hour of the
predicted time)
|
3
(1 m below
water surface, mid-depth and 1 m above sea bed, except where the water depth
is less than 6 m, in which case the mid-depth station may be omitted.
Should the water depth be less than 3 m, only the mid-depth station will be
monitored).
|
4.4.1 In accordance with
the Project Specific EM&A Manual, twenty-one stations (9 Impact Stations, 7
Sensitive Receiver Stations and 5 Control/Far Field Stations) were designated
for impact water quality monitoring. The nine Impact Stations (IS) were chosen
on the basis of their proximity to the reclamation and thus the greatest
potential for water quality impacts, the seven Sensitive Receiver Stations (SR)
were chosen as they are close to the key sensitive receives and the five
Control/ Far Field Stations (CS) were chosen to facilitate comparison of the
water quality of the IS stations with less influence by the Project/ ambient
water quality conditions.
4.4.2 Due to safety concern
and topographical condition of the original locations of SR4 and SR10B, alternative
impact water quality monitoring stations, naming as SR4 (N) and SR10B (N), were
adopted, which are situated in vicinity of the original impact water quality
monitoring stations (SR4 and SR10B) and could be reachable.
4.4.3 Same baseline and
Action Level for water quality, as derived from the baseline monitoring data
recorded, were adopted for these alternative impact water quality monitoring
stations.
4.4.4 The locations of
these monitoring stations are summarized in Table 4.3 and depicted in Figure 3.
Table 4.3 Impact
Water Quality Monitoring Stations
|
Station
|
Description
|
East
|
North
|
|
IS5
|
Impact Station (Close to HKBCF
construction site)
|
811579
|
817106
|
|
IS(Mf)6
|
Impact Station (Close to HKBCF
construction site)
|
812101
|
817873
|
|
IS7
|
Impact Station (Close to HKBCF
construction site)
|
812244
|
818777
|
|
IS8
|
Impact Station (Close to HKBCF
construction site)
|
814251
|
818412
|
|
IS(Mf)9
|
Impact Station (Close to HKBCF
construction site)
|
813273
|
818850
|
|
IS10
|
Impact Station (Close to HKBCF
construction site)
|
812577
|
820670
|
|
IS(Mf)11
|
Impact Station (Close to
HKBCF construction site)
|
813562
|
820716
|
|
IS(Mf)16
|
Impact Station (Close to HKBCF
construction site)
|
814328
|
819497
|
|
IS17
|
Impact Station (Close to HKBCF
construction site)
|
814539
|
820391
|
|
SR3
|
Sensitive receivers (San Tau
SSSI)
|
810525
|
816456
|
|
SR4(N)
|
Sensitive receivers (Tai Ho)
|
814705
|
817859
|
|
SR5
|
Sensitive receivers
(Artificial Reef in NE Airport)
|
811489
|
820455
|
|
SR6
|
Sensitive receivers (Sha Chau
and Lung Kwu Chau Marine Park)
|
805837
|
821818
|
|
SR7
|
Sensitive receivers (Tai Mo Do)
|
814293
|
821431
|
|
SR10A
|
Sensitive receivers (Ma Wan
FCZ)1
|
823741
|
823495
|
|
SR10B(N)
|
Sensitive receivers (Ma Wan
FCZ)2
|
823683
|
823187
|
|
CS(Mf)3
|
Control Station
|
809989
|
821117
|
|
CS(Mf)5
|
Control Station
|
817990
|
821129
|
|
CS4
|
Control Station
|
810025
|
824004
|
|
CS6
|
Control Station
|
817028
|
823992
|
|
CSA
|
Control Station
|
818103
|
823064
|
4.5.1 Instrumentation
(a)
The in-situ water quality
parameters, viz. dissolved oxygen, temperature, salinity, turbidity and pH,
were measured by multi-parameter meters (i.e. Model YSI 6820 CE-C-M-Y) and pH meter
(i.e. Thermo Orion 230A+) respectively.
4.5.2 Operating/Analytical
Procedures
(a)
Digital Differential Global Positioning Systems (DGPS) were used to ensure that the correct location was selected prior to
sample collection.
(b)
Portable, battery-operated echo
sounders were used for the determination of water depth at each designated
monitoring station.
(c)
All in-situ measurements were
taken at 3 water depths, 1 m below water surface, mid-depth and 1 m above sea bed,
except where the water depth was less than 6 m, in which case the mid-depth
station was omitted. Should the water depth be less than 3 m, only the
mid-depth station was monitored.
(d)
At each measurement/sampling
depth, two consecutive in-situ monitoring (DO concentration and saturation,
temperature, turbidity, pH, salinity) and water sample for SS. The probes were
retrieved out of the water after the first measurement and then re-deployed for
the second measurement. Where the difference in the value between the first and
second readings of DO or turbidity parameters was more than 25% of the value of
the first reading, the reading was discarded and further readings were taken.
(e)
Duplicate samples from each
independent sampling event were collected for SS measurement. Water samples
were collected using the water samplers and the samples were stored in
high-density polythene bottles. Water samples collected were well-mixed in the
water sampler prior to pre-rinsing and transferring to sample bottles. Sample
bottles were pre-rinsed with the same water samples. The sample bottles were
then be packed in cool-boxes (cooled at 4oC without being frozen),
and delivered to ALS Technichem (HK) Pty Ltd. for the analysis of suspended
solids concentrations. The laboratory determination work would be started
within 24 hours after collection of the water samples. ALS Technichem (HK) Pty Ltd. is a
HOKLAS accredited laboratory and has comprehensive quality assurance and
quality control programmes. For QA/QC procedures, one duplicate samples of
every batch of 20 samples was analyzed.
(f)
The analysis method and reporting
and detection limit for SS is shown in Table 4.4.
Table 4.4 Laboratory
Analysis for Suspended Solids
|
Parameters
|
Instrumentation
|
Analytical Method
|
Reporting Limit
|
Detection Limit
|
|
Suspended Solid (SS)
|
Weighting
|
APHA 2540-D
|
0.5mg/L
|
0.5mg/L
|
(g)
Other relevant data were
recorded, including monitoring location / position, time, water depth, tidal
stages, weather conditions and any special phenomena or work underway at the
construction site in the field log sheet for information.
4.5.3 Maintenance and
Calibration
(a)
All in situ monitoring
instruments would be calibrated and calibrated by ALS Technichem (HK) Pty Ltd.
before use and at 3-monthly intervals throughout all stages of the water
quality monitoring programme. Calibration
details are provided in Appendix E.
(b)
The dissolved oxygen probe of YSI
6820 was calibrated by wet bulb method. Before the calibration routine, the
sensor for dissolved oxygen was thermally equilibrated in water-saturated air.
Calibration cup is served as a calibration chamber and it was loosened from
airtight condition before it is used for the calibration. Calibration at ALS
Technichem (HK) Pty Ltd. was carried out once every three months in a water
sample with a known concentration of dissolved oxygen. The sensor was immersed
in the water and after thermal equilibration, the known mg/L value was keyed in
and the calibration was carried out automatically.
(c)
The turbidity probe of YSI 6820 is
calibrated two times a month. A zero check in distilled water was performed
with the turbidity probe of YSI 6820 once per monitoring day. The probe will be
calibrated with a solution of known NTU at ALS Technichem (HK) Pty Ltd. once
every three months.
4.6
Monitoring Schedule for the Reporting Month
4.6.1 The schedule for
impact water quality monitoring in November 2013 is provided in
Appendix F.
4.7.1 Impact water quality monitoring
was conducted at all designated monitoring stations in the reporting month.
Except Impact water quality monitoring at sampling location IS(Mf)9. Sampling
location IS(Mf)9 was found enclosed by silt curtain during the reporting month.
Samples were taken about 140 meters away from IS(Mf)9. The sampling location��s
coordination (East 813226, North 818708) was recorded. The
Contractor was advised to take corrective actions to the temporary arrangement
of the perimeter silt curtain as soon as possible.
4.7.2 Impact water quality
monitoring results and graphical presentations are provided in Appendix J.
4.7.4
Fifteen (15) Action Level
exceedances were recorded at measured suspended solids (SS) values (in mg/L) in
the reporting month. No Limit Level Exceedances were recorded at measured
suspended solids (SS) values (in mg/L) in the reporting month. The number of
exceedances recorded in the reporting month at each impact station is
summarized in Table 4.5.
Table 4.5 Summary of Water Quality Exceedances
|
Station
|
Exceedance Level
|
DO (S&M)
|
DO (Bottom)
|
Turbidity
|
SS
|
Total
|
|
Ebb
|
Flood
|
Ebb
|
Flood
|
Ebb
|
Flood
|
Ebb
|
Flood
|
Ebb
|
Flood
|
|
IS5
|
Action
|
0
|
0
|
0
|
0
|
0
|
0
|
0
|
(1)
22 Nov13
|
0
|
1
|
|
Limit
|
0
|
0
|
0
|
0
|
0
|
0
|
0
|
0
|
0
|
0
|
|
IS(Mf)6
|
Action
|
0
|
0
|
0
|
0
|
0
|
0
|
(1)
11 Nov
13
|
(2)
11&20 Nov
13
|
1
|
2
|
|
Limit
|
0
|
0
|
0
|
0
|
0
|
0
|
0
|
0
|
0
|
0
|
|
IS7
|
Action
|
0
|
0
|
0
|
0
|
0
|
0
|
0
|
(1)
20 Nov13
|
0
|
1
|
|
Limit
|
0
|
0
|
0
|
0
|
0
|
0
|
0
|
0
|
0
|
0
|
|
IS8
|
Action
|
0
|
0
|
0
|
0
|
0
|
0
|
0
|
0
|
0
|
0
|
|
Limit
|
0
|
0
|
0
|
0
|
0
|
0
|
0
|
0
|
0
|
0
|
|
IS(Mf)9
|
Action
|
0
|
0
|
0
|
0
|
0
|
0
|
0
|
(1)
15 Nov13
|
0
|
1
|
|
Limit
|
0
|
0
|
0
|
0
|
0
|
0
|
0
|
|
0
|
|
|
IS10
|
Action
|
0
|
0
|
0
|
0
|
0
|
0
|
0
|
(1)
6 Nov13
|
0
|
1
|
|
Limit
|
0
|
0
|
0
|
0
|
0
|
0
|
0
|
0
|
0
|
0
|
|
IS(Mf)11
|
Action
|
0
|
0
|
0
|
0
|
0
|
0
|
0
|
0
|
0
|
0
|
|
Limit
|
0
|
0
|
0
|
0
|
0
|
0
|
0
|
0
|
0
|
0
|
|
IS(Mf)16
|
Action
|
0
|
0
|
0
|
0
|
0
|
0
|
(1)
4 Nov
13
|
0
|
1
|
0
|
|
Limit
|
0
|
0
|
0
|
0
|
0
|
0
|
0
|
0
|
0
|
0
|
|
IS17
|
Action
|
0
|
0
|
0
|
0
|
0
|
0
|
(2)
4 &15 Nov
13
|
0
|
2
|
0
|
|
Limit
|
0
|
0
|
0
|
0
|
0
|
0
|
0
|
0
|
0
|
0
|
|
SR3
|
Action
|
0
|
0
|
0
|
0
|
0
|
0
|
0
|
(1)
22 Nov13
|
0
|
1
|
|
Limit
|
0
|
0
|
0
|
0
|
0
|
0
|
0
|
0
|
0
|
0
|
|
SR4(N)
|
Action
|
0
|
0
|
0
|
0
|
0
|
0
|
0
|
(1)
13 Nov13
|
0
|
1
|
|
Limit
|
0
|
0
|
0
|
0
|
0
|
0
|
0
|
0
|
0
|
0
|
|
SR5
|
Action
|
0
|
0
|
0
|
0
|
0
|
0
|
0
|
(1)
6 Nov13
|
0
|
1
|
|
Limit
|
0
|
0
|
0
|
0
|
0
|
0
|
0
|
0
|
0
|
|
|
SR6
|
Action
|
0
|
0
|
0
|
0
|
0
|
0
|
0
|
(1)
6 Nov13
|
0
|
1
|
|
Limit
|
0
|
0
|
0
|
0
|
0
|
0
|
0
|
0
|
|
|
|
SR7
|
Action
|
0
|
0
|
0
|
0
|
0
|
0
|
0
|
0
|
0
|
0
|
|
Limit
|
0
|
0
|
0
|
0
|
0
|
0
|
0
|
0
|
0
|
0
|
|
SR10A
|
Action
|
0
|
0
|
0
|
0
|
0
|
0
|
0
|
0
|
0
|
0
|
|
Limit
|
0
|
0
|
0
|
0
|
0
|
0
|
0
|
0
|
0
|
0
|
|
SR10B
(N)
|
Action
|
0
|
0
|
0
|
0
|
0
|
0
|
0
|
(1)
6 Nov13
|
0
|
1
|
|
Limit
|
0
|
0
|
0
|
0
|
0
|
0
|
0
|
0
|
0
|
0
|
|
Total
|
Action
|
0
|
0
|
0
|
0
|
0
|
0
|
4
|
11
|
15
|
|
|
Limit
|
0
|
0
|
0
|
0
|
0
|
0
|
0
|
0
|
0
|
Note: S:
Surface; and
M:
Mid-depth.
4.7.5 Two
(2) Action Level exceedances at measured Suspended Solids (mg/L) were recorded on 04 Nov2013 at monitoring
station IS(Mf) 16 and IS(17 at Mid-Ebb tide and Mid-Flood tide respectively.
For Action Level exceedances at measured Suspended Solids (mg/L), 24.3 mg/L and
31.6 mg/L was
recorded at Monitoring
Station IS(Mf)16 and IS(Mf)9 respectively.
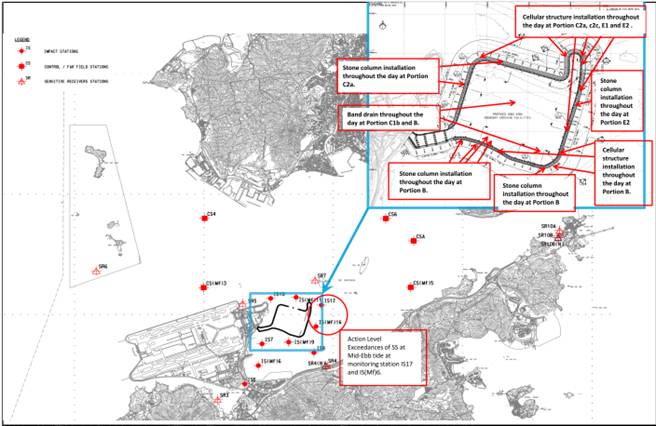
4.7.5.1
For locations and type of active
works carried out on 4 Nov 13, please refer to the above layout map.
4.7.5.2
For action level exceedance of
suspended solid recorded at IS(Mf)16 and IS17 during mid ebb tide, active works
were carried out at almost the same locations on 1, 4 and 6 Nov 13, but all
Suspended Solids results recorded at all monitoring location on 1 and 6 Nov 13
are all below the Action and Limit Level during the same tide on the same day
which indicates active works is unlikely to adversely affect the water quality
at IS(Mf)16 and IS17
4.7.5.3
When impact water quality
monitoring was carried out during mid ebb tide at monitoring location IS(Mf)16
and IS17on 4 Nov 13, no silty plume were observed to flow from the inside to
the outside of the site boundary.
4.7.5.4
Turbidity level (NTU) result
recorded on 4 Nov 13 at IS(Mf)16 during ebb tide and IS17 during flood tide is
17.2 NTU and 18.4 NTU respectively which were below the Action and Limit Level,
this indicates turbidity level was not adversely affected. (Please see attached
photo record of the sea condition taken on 4 Nov 13.)
4.7.5.5
Photo record shows that no defect
was observed on the perimeter silt curtain nearby IS(Mf)16 and IS17. (Please
see attached photo record)
4.7.5.6
When impact water quality
monitoring was carried out at IS(Mf)16 during mid ebb tide and at IS(Mf)9
during mid flood tide, no discoloration of sea water was observed and no silty
plume were observed to flow from the inside to the outside of the site
boundary.
Photo
record of the sea condition taken on 4 Nov 13
Photo record
of site condition nearby IS(Mf)6
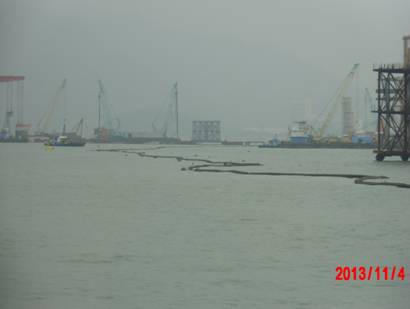
Photo record
shows site condition nearby IS17
4.7.5.7
The recorded suspended solids
values recorded on 4 Nov13 at monitoring station IS(Mf)11, IS(Mf)9 and IS(Mf)8
during ebb tide were below the action and limit level which shows that the
water quality nearby IS(Mf)16 and IS17during ebb tide were not adversely
affected.
4.7.5.8
The exceedances were likely due to
local effects in the vicinity of IS(Mf)16 and IS17.
4.7.5.9
Nevertheless, the Contractor was
reminded to ensure provision of ongoing maintenance to the silt curtains and to
carry out maintenance work once defects were found.
4.7.5.10 Maintenance work of the silt curtain was carried out by the Contractor
on a daily basis except Sunday and public holiday.
4.7.6 Four
(4) Action Level exceedances at measured Suspended Solids (mg/L) were recorded
on 06 Nov 2013 during mid-flood tide at monitoring station IS10 and SR5. For
Action Level exceedances at measured Suspended Solids (mg/L), 30.8 mg/L, 27.0
mg/L, 31.9 mg/L and 25.2 mg/L were recorded at Monitoring Station IS10,
SR10B(N) , SR5 and SR6 respectively.
4.7.6.1
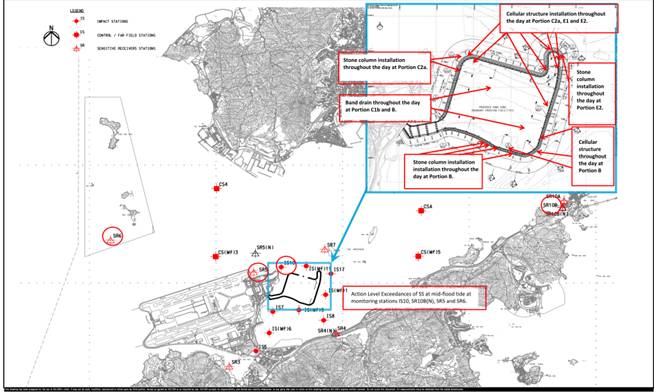
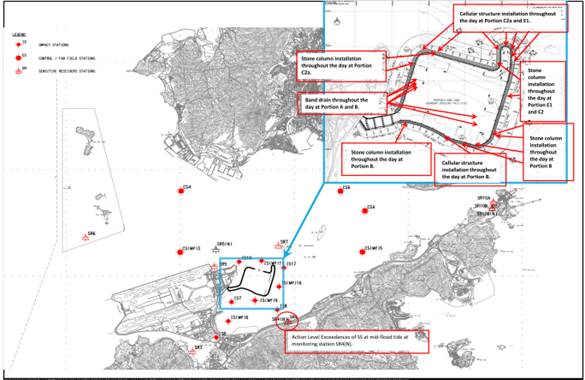
Active works like stone column and cellular structure installation were
carried out at Portion C2a, E1, E2 and B but no exceedance was recorded at
IS(Mf)11 which IS(Mf)11 is considered downstream and closer to active works of
Portion E1 and E2. No exceedance was recorded at IS7 which IS7 is considered
downstream to active works of Portion B.
4.7.6.2
Exceedances (IS10, SR5 and SR6)
recorded at stations which are considered located downstream and closest to
active works at Portion C2a during flood tide.
4.7.6.3
IS7 which is closer to the active
works at portion B than it is for monitoring station IS10 and SR5 and the
suspended solids level of IS7 at mid flood tide were below the action and limit
level which indicates that active works from portion B were unlikely to cause
SS exceedance at monitoring station IS10 and SR5.
4.7.6.4
Hence, active works like stone
column and cellular structure installation carried out at Portion E1, E2 and B
were unlikely to cause exceedance.
4.7.6.5
When monitoring was conducted, no
turbid water was observed at SR7 and IS(Mf)11, but turbid water was observed at
IS10, SR5 an SR6 which is located downstream to to active works at Portion C2a during
flood tide.
4.7.6.6
However, with refer to the silt
curtain condition on 6 and 8 Nov
13, defects of the perimeter silt curtain was observed at southwest and
northwest of the construction site but no exceedance was observed on 8 Nov 13
at IS10, SR5, SR6 and SR10B(N).
4.7.6.7
Almost same type and location of
works were conducted by vessels on 4, 6 and 8 Nov 13 but no exceedance were
recorded on 4 and 8 Nov 13, indicating works conducted by vessels unlikely to
cause the exceedances.
4.7.6.8
Monitoring results show no
recurrence of exceedance of SS at IS10, SR5, SR6 and SR10B(N) on 8 Nov 13
indicating the exceedance of SS at IS10, SR5, SR6 and SR10B(N) during flood
tide are unlikely due to marine work activities shown on the attached layout.
4.7.6.9
SR10B(N) is considered upstream to
active works during flood tide and no exceedance was recorded at CS6, CSA, CS(Mf)5,
IS(Mf)16 and IS7 which are closer to the HKBCF. Therefore, the exceedance
recorded at SR10B(N) is not likely to be contributed from active work of HKBCF
which is located downstream to SR10B(N).
4.7.6.10 As such, the exceedances recorded at IS10, SR5, SR6 and SR10B(N) were
considered as non-Project related.
4.7.6.11 Nevertheless, the Contractor was reminded to ensure provision of ongoing
maintenance to the silt curtains and to carry out maintenance work once defects
were found.
4.7.6.12 Maintenance work of the silt curtain was carried out by the Contractor
on a daily basis except Sunday and public holiday.
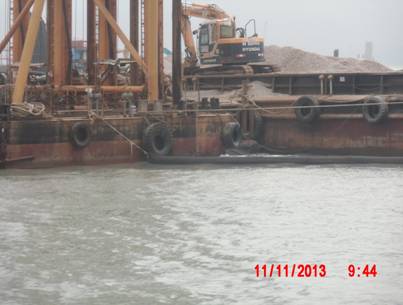
Photo
record of the sea condition taken on 6 Nov 13
Condition of sea and
silt curtain on 6 November 2013 (the northwest side of BCF)
4.7.7 Two
(3) Action Level exceedances at measured Suspended Solids (mg/L) where recorded on 11 Nov 13 2013 during mid-flood tide and mid-ebb
tide at monitoring
station IS(Mf)16. For Action Level exceedance at measured Suspended Solids
(mg/L), 27.9mg/L and 26.4mg/L was recorded at Monitoring Station IS(Mf)16
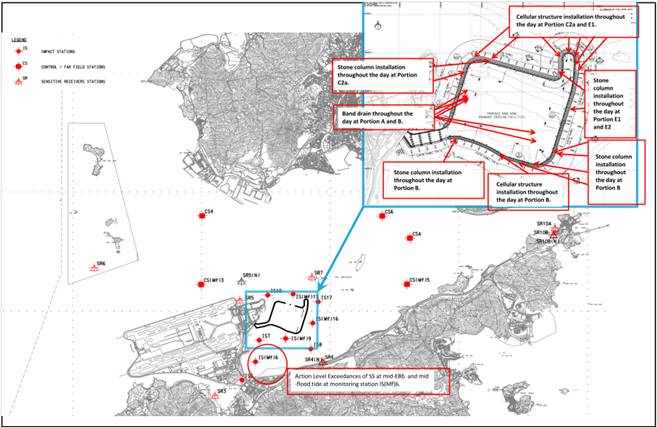
4.7.7.1
Please refer the above layout map
for activity carried out on 11 Nov 13.
4.7.7.2
Suspended Solids values recorded
at Impact Station IS(Mf)9 and IS7 which are closer to the works than monitoring
station IS(Mf)6 are all below the Action and Limit Level during the same tide
on the same day. This indicates that active works is unlikely to cause the
exceedances at IS(Mf)6.
4.7.7.3
Almost same type and location of
works were carried out at the same location on 8, 11 and 13 Nov 13 but
Suspended Solids values recorded at IS(Mf)6 on 8 and 13 Nov 13 are all below
the Action and Limit Level during the same tide on the same day. This indicates
that active works is unlikely to cause the exceedance at IS(Mf)6.
4.7.7.4
Monitoring results show no
recurrence of exceedance of SS at IS(Mf)6 on 13 Nov 13 indicating the
exceedances of SS at IS(Mf)6 during flood and ebb tide are unlikely due to
marine work activities shown on the attached layout map.
4.7.7.5
Localised silt curtain was implemented
during stone column installation. (Please refer to the photo record attached)
4.7.7.6
No defects of perimeter silt
curtain was observed at the proximity of IS(Mf)6. (Please refer to the photo
record attached)
Photo
record of the sea condition taken on 11 Nov 13
Implementation of localised silt
curtain during stone column installation
Condition of silt curtain at near
the monitoring station IS(Mf)6
4.7.7.7
As such, the exceedances recorded
at IS(Mf)6 during both tide were considered as non-Project related.
4.7.7.8
The exceedance was likely due to
local effects in the vicinity of IS(Mf)6.
4.7.7.9
Nevertheless, the Contractor was
reminded to ensure provision of ongoing maintenance to the silt curtains and to
carry out maintenance work once defects were found.
4.7.7.10 Maintenance work of the silt curtain was carried out by the Contractor
on a daily basis except Sunday and public holiday.
4.7.8 One
(1) Action Level exceedance at measured Suspended Solids (mg/L) was recorded on
13 Nov 13 during mid-flood tide at monitoring station SR4(N). For Action Level
exceedance at measured Suspended Solids (mg/L), 3 mg/L was recorded.
4.7.8.1
Please refer the above layout map
for activity carried out on 13 Nov13.
4.7.8.2 IS(Mf)9, IS8 and IS(Mf)16 are located
closer to the active works than monitoring station SR4(N). Depth Averaged
Suspended Solids (SS) values (in mg/L) recorded during the flood tide on the
same day at IS(Mf)9, IS8 and IS(Mf)16 were below the Action and Limit Level
which indicates project works is unlikely to contribute to the action level
exceedance recorded at SR4(N).
4.7.8.3 The monitoring location of monitoring station
SR4(N) are considered upstream to the active works of this project during flood
tide. Therefore it was unlikely that the exceedance recorded at SR4(N) was due
to active construction activities of this project.
4.7.8.4
The exceedance was likely due to
local effects in the vicinity of SR4(N).
4.7.8.5
Nevertheless, the Contractor was
reminded to ensure provision of ongoing maintenance to the silt curtains and to
carry out maintenance work once defects were found.
4.7.8.6
Maintenance work of the silt
curtain was carried out by the Contractor on a daily basis except Sunday and
public holiday.
Photo
record of the sea condition taken on 13 Nov 13
|
Condition of silt curtain
near the monitoring station SR4(N).
|
|
|
|
|
|
|
|
|
|
|
|
|
|
|
|
|
|
|
|
|
|
|
|
|
|
|
|
|
|
|
|
|
|
|
|
|
|
|
|
|
|
|
|
|
|
|
|
|
|
|
|
|
|
|
|
|
|
|
|
|
|
|
|
|
|
|
|
|
|
|
|
|
|
|
|
|
|
|
|
|
|
|
|
|
|
|
|
|
|
|
|
|
|
|
|
|
|
|
|
|
|
|
|
|
|
|
|
|
|
|
|
|
|
|
|
|
|
|
|
|
|
|
|
|
|
|
|
|
|
|
|
|
|
|
|
|
|
|
|
|
|
|
|
|
|
|
|
|
|
|
|
|
|
|
|
|
|
|
|
|
|
|
|
|
|
|
|
|
|
|
|
|
|
|
|
|
|
|
|
|
|
|
|
|
|
|
|
|
|
|
|
|
|
|
|
|
|
|
|
|
|
|
|
|
|
|
|
|
|
|
|
|
|
|
|
|
|
|
|
|
|
|
|
|
|
|
|
|
|
|
|
|
|
|
|
|
|
|
|
|
|
|
|
|
|
|
|
|
|
|
|
|
|
|
|
|
|
|
|
|
|
|
|
|
|
|
|
|
|
|
|
|
|
|
|
|
|
|
|
|
|
|
|
|
|
|
|
|
|
|
|
|
|
|
|
|
|
|
|
|
|
|
|
|
|
|
|
|
|
|
|
|
|
|
|
|
|
|
|
|
|
|
|
|
|
|
|
|
|
|
|
|
|
|
|
|
|
|
|
|
|
|
|
|
|
|
|
|
4.7.9 Two
(2) action level exceedance of SS was recorded on 15 Nov 13 at monitoring
station SR10(B)N and SS level of 23.8 mg/L was recorded.
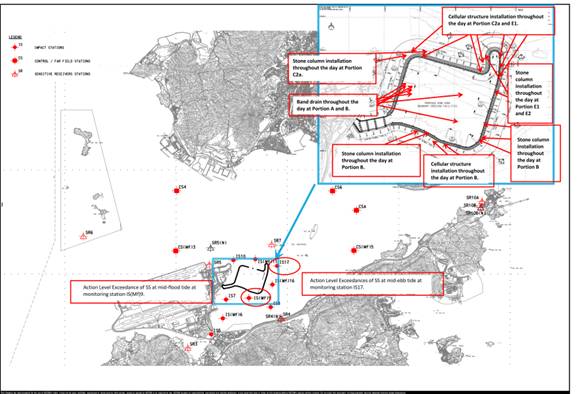
4.7.9.1
Please refer the below layout map for
activity carried out on 15 Nov 13.
4.7.9.2
Turbidity level (NTU) results
recorded on 15 Nov 13 at IS17 during ebb tide and IS(Mf)9 during flood tide is
23.4 NTU and 20.4 NTU respectively which were below the Action and Limit Level,
this indicates turbidity level was not adversely affected. (Please see attached
photo record of the sea condition taken on 15 Nov 13.)
4.7.9.3
Almost the same type of works at
the same locations were carried out at the same location on 13, 15 and 18 Nov
13 but Suspended Solids values recorded at IS17 and IS(Mf)9 on 13 and 18 Nov 13
are all below the Action and Limit Level during the same tide on the same day
which indicates active works is unlikely to adversely affect the water quality
at IS17 and IS(Mf)9.
4.7.9.4
Refer to the attached layout map,
active works were noted directly upstream to IS(Mf)9 during flood tide and IS17
during ebb tide, but no defects at south aligment (Nearby IS(Mf)9 and the
northwest aligment of the perimeter silt curtain (nearby SI17) when monitoring
was conducted on 15 Nov 13.
4.7.9.5
The exceedances were likely due to
local effects in the vicinity of IS17 and IS(Mf)9.
4.7.9.6
The exceedances were considered as
Non-project related
4.7.9.7
Nevertheless, the Contractor was
reminded to ensure provision of ongoing maintenance to the silt curtains and to
carry out maintenance work once defects were found.
4.7.9.8
Maintenance work of the silt
curtain was carried out by the Contractor on a daily basis except Sunday and
public holiday.
Photo
record of the sea condition taken on 15 Nov 13
4.7.10
Two (2) Action level exceedance of SS was
recorded on 20 Nov 13 at monitoring station IS(Mf)6 and IS7 SS level of
31.5mg/L and 23.7mg/L was recorded for IS(Mf)6 and IS7 respectively. 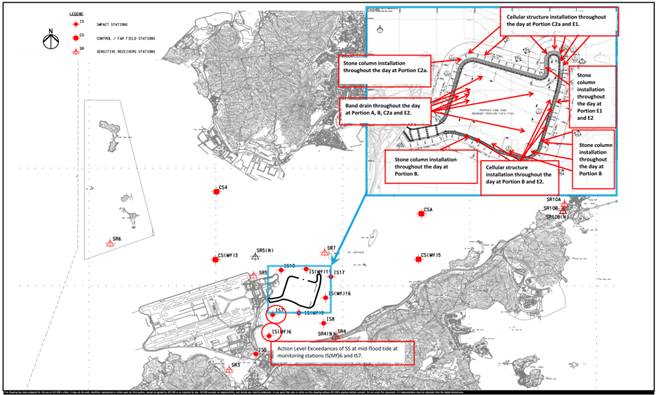
4.7.10.1 Please refer attached
Layout Maps for work activity carried out on 22 Nov 13.
4.7.10.2 Turbidity level (NTU)
results recorded on 20 Nov 13 at IS(Mf)6 and IS7 during flood tide is 24.5 NTU
and 8.7 NTU respectively which were below the Action and Limit Level, this indicates
turbidity level was not adversely affected. (Please see attached photo record
of the sea condition taken on 20 Nov 13.)
4.7.10.3 S(Mf)9 is located
closer to the active works than monitoring stations IS(Mf)6 and IS7. Depth
Averaged Suspended Solids (SS) values (in mg/L) recorded during the flood tide
on the same day at IS(Mf)9 was below the Action and Limit Level which indicates
that the water quality nearby IS(Mf)6 and IS7 during the monitoring period were
not adversely affected.
4.7.10.4 Almost the same type of
works at the same locations were carried out at the same location on 18 and 22
Nov 13 but Suspended Solids values recorded at IS(Mf)6 and IS7 on 18 and 22 Nov
13 are all below the Action and Limit Level during the same tide on the same
day which indicates active works is unlikely to adversely affect the water
quality at IS(Mf)6 and IS7.
4.7.10.5 Refer to the attached
layout map, active works were noted directly upstream to IS(Mf)6 and IS7 during
flood tide, but no defects at the northwest alignment of the perimeter silt
curtain (nearby SI(Mf)11) when monitoring was conducted on 20 Nov 13.
4.7.10.6 Localised silt curtain
was implemented during stone column installation. (Please refer to the photo
record attached)
4.7.10.7 No defects of
perimeter silt curtain was observed at the proximity of IS(Mf)6 and IS7.
(Please refer to the photo record attached)
4.7.10.8 The exceedances were
likely due to local effects in the vicinity of IS(Mf)6 and IS7.
4.7.10.9 The exceedances were
considered as Non-project related
4.7.10.10
Nevertheless, the Contractor was reminded
to ensure provision of ongoing maintenance to the silt curtains and to carry
out maintenance work once defects were found.
4.7.10.11
Maintenance work of the silt curtain was
carried out by the Contractor on a daily basis except Sunday and public
holiday.
Photo
record of the sea condition taken on 20 Nov 13
Condition of silt
curtain near the monitoring station IS(Mf)6 and IS7.
4.7.11 Two (2) Action level exceedance of SS was recorded on 22 Nov 13 at
monitoring station IS5 and SR3 SS level of 24.6mg/L and 23.7mg/L was recorded
for IS5 and SR3 respectively.
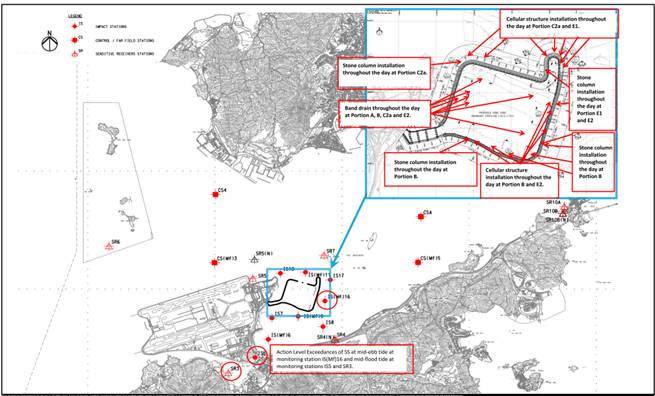
4.7.11.1 Please refer attached Layout Maps for work
activity carried out on 22 Nov 13.
4.7.11.2 During Mid-ebb Tide : Turbidity level (NTU) results recorded on 22 Nov 13
at IS(Mf)16 during ebb tide is 22.5 NTU which were below the Action and Limit
Level, this indicates turbidity level was not adversely affected. (Please see
attached photo record of the sea condition taken on 22 Nov 13.)
4.7.11.3 IS17 and IS(Mf)11 which are
located closer to the active works than monitoring stations IS(Mf)16. Depth
Averaged Suspended Solids (SS) values (in mg/L) recorded during the ebb tide on
the same day at IS17 and IS(Mf)11 were below the Action and Limit Level which
indicates that the water quality nearby IS(Mf)16 during the monitoring period
were not adversely affected.
4.7.11.4 Almost the same type of works at the same
locations were carried out at the same location on 18, 20 and 22 Nov 13 but
Suspended Solids values recorded at IS(Mf)16 on 18, 20 and 22 Nov 13 are all
below the Action and Limit Level during the same tide on the same day which
indicates active works is unlikely to adversely affect the water quality at
IS(Mf)16.
4.7.11.5 Localised silt curtain was
implemented during stone column installation. (Please refer to the photo record
attached)
4.7.11.6 No defects of perimeter silt curtain
was observed at the proximity of IS(Mf)16. (Please refer to the photo record
attached)
4.7.11.7 During Mib-flood Tide: Turbidity level (NTU) results recorded on 22 Nov 13 at IS5 and SR3
during flood tide is 15.7 NTU and 18.7 NTU respectively which were below the
Action and Limit Level, this indicates turbidity level was not adversely
affected. (Please see attached photo record of the sea condition taken on 22
Nov 13.)
4.7.11.8 IS(Mf)9 and IS7 are
located closer to the active works than monitoring stations IS5 and SR3. Depth
Averaged Suspended Solids (SS) values (in mg/L) recorded during the flood tide
on the same day at IS(Mf)9 and IS7 were below the Action and Limit Level which
indicates project works is unlikely to contribute to the action level
exceedance recorded at IS5 and SR3.
4.7.11.9 The monitoring location of
monitoring stations IS5 and SR3 are considered upstream to the active works of
this project during flood tide. Therefore it was unlikely that the exceedances
recorded at IS5 and SR3 were due to active construction activities of this
project.
4.7.11.10 The
exceedances were likely due to local effects in the vicinity of IS5 and SR3.
4.7.11.11 The
exceedances were considered as Non-project related
4.7.11.12 Nevertheless, the Contractor was
reminded to ensure provision of ongoing maintenance to the silt curtains and to
carry out maintenance work once defects were found.
4.7.12 The event action plan is annexed in Appendix L.
Photo
record of the sea condition taken on 22 Nov 13
Implementation of
localised silt curtain during stone column installation near the monitoring
station IS(Mf)16.
|
|
|
|
|
|
|
|
|
|
|
|
|
|
|
|
|
|
|
|
|
|
|
|
|
|
|
|
|
|
|
|
|
|
|
|
|
|
|
|
|
|
|
|
|
|
|
|
|
|
|
|
|
|
|
|
|
|
|
|
|
|
|
|
|
|
|
|
|
|
|
|
|
|
|
|
|
|
|
|
|
|
|
|
|
|
|
|
|
|
|
|
|
|
|
|
|
|
|
|
|
|
|
|
|
|
|
|
|
|
|
|
|
|
|
|
|
|
|
|
|
|
|
|
|
|
|
|
|
|
|
|
|
|
|
|
|
|
|
|
|
|
|
|
|
|
|
|
|
|
|
|
|
|
|
|
|
|
|
|
|
|
|
|
|
|
|
|
|
|
|
|
|
|
|
|
|
|
|
|
|
|
|
|
|
|
|
|
|
|
|
|
|
|
|
|
|
|
|
|
|
|
|
|
|
|
|
|
|
|
|
|
|
|
|
|
|
|
|
|
|
|
|
|
|
|
|
|
|
|
|
|
|
|
|
|
|
|
|
|
|
|
|
|
|
|
|
|
|
|
|
|
 Condition of silt curtain at the southern aligment. Condition of silt curtain at the southern aligment.
|
|
|
|
|
|
|
|
|
|
|
|
|
|
|
|
|
|
|
|
|
|
|
|
|
|
|
|
|
|
|
|
|
|
|
|
|
|
|
|
|
|
|
|
|
|
|
|
|
|
|
|
|
|
|
|
|
|
|
|
|
|
|
|
|
|
|
|
|
|
|
|
|
|
|
|
|
|
|
|
|
|
|
|
|
|
|
|
|
|
|
|
|
|
|
|
|
|
|
|
|
|
|
|
|
|
|
|
|
|
|
|
|
|
|
|
|
|
|
|
|
|
|
|
|
|
|
|
|
|
|
|
|
5
Dolphin monitoring
5.1.1 Vessel based surveys
for the Chinese White Dolphin (CWD),
Sousa chinensis, are to be conducted by a dedicated team comprising a
qualified marine mammal ecologist and experienced marine mammal observers
(MMOs). The purpose of the surveys are to evaluate the impact of the HKCBF
reclamation and, if deemed detrimental, to take appropriate action as per the EM&A
manual.
5.1.2 This ��Impact
Monitoring�� follows several months of ��Baseline Monitoring�� so similar survey
methodologies have been adopted to facilitate comparisons between
datasets. Further, the data
collected are compatible with, and are available for, incorporation into the
data set managed by the Agriculture, Fisheries and Conservation Department
(AFCD) as part of Hong Kong��s long term Marine Mammal Monitoring Programme.
5.2.1 Table 5.1 summarises
the equipment used for the impact dolphin monitoring.
Table 5.1 Dolphin
Monitoring Equipment
|
Equipment
|
Model
|
|
Commercially licensed motor
vessel
|
15m in length with a 4.5m viewing platform
|
|
Global Positioning System (GPS) x2
|
Integrated into T7000
Garmin GPS Map 78C
|
|
Computers (T7000
Tablet, Intel Atom)
|
Windows 7/MSO 13
Logger
|
|
Camera
|
Nikon D90 300m 2.8D fixed focus
Nikon D90 20-400m zoom lens
|
|
Laser Rangefinder
|
Infinitor LRF1000/ Kings 950
|
|
Marine Binocular x3
|
Nexus 7 x 50 marine binocular with compass
and reticules
Fujinon 7 x 50
marine binocular with compass and reticules
|
5.3.1 Dolphin monitoring is
conducted twice per month in each survey area.
5.3.2 Dolphin monitoring is
conducted only when visibility is good (e.g., over 1km) and the sea condition
is at a Beaufort Sea State of 4 or better.
5.3.3 When thunder storm,
black rain or typhoon warnings are in force, all survey effort is stopped.
5.4.1 The impact dolphin
monitoring is vessel-based and combines line-transect and photo-ID
methodology. The survey follows
pre-set and fixed transect lines in the two areas defined by AFCD as:
5.4.2
Northeast Lantau survey area; and
5.4.3
Northwest Lantau survey area.
5.4.4 The co-ordinates for
the transect lines and layout map have been provided by AFCD and are shown in
Table 5.2 and Figure 4.
Table 5.2 Impact
Dolphin Monitoring Line Transect Co-ordinates (Provided by AFCD)
|
|
HK Grid System
|
Long Lat in WGS84
|
|
ID
|
X
|
Y
|
Long
|
Lat
|
|
1
|
804671
|
814577
|
113.870308
|
22.269741
|
|
1
|
804671
|
831404
|
113.869975
|
22.421696
|
|
2
|
805475
|
815457
|
113.878087
|
22.277704
|
|
2
|
805477
|
826654
|
113.877896
|
22.378814
|
|
3
|
806464
|
819435
|
113.887615
|
22.313643
|
|
3
|
806464
|
822911
|
113.887550
|
22.345030
|
|
4
|
807518
|
819771
|
113.897833
|
22.316697
|
|
4
|
807518
|
829230
|
113.897663
|
22.402113
|
|
5
|
808504
|
820220
|
113.907397
|
22.320761
|
|
5
|
808504
|
828602
|
113.907252
|
22.396462
|
|
6
|
809490
|
820466
|
113.916965
|
22.323003
|
|
6
|
809490
|
825352
|
113.916884
|
22.367128
|
|
7
|
810499
|
820690
|
113.926752
|
22.325043
|
|
7
|
810499
|
824613
|
113.926688
|
22.360464
|
|
8
|
811508
|
820847
|
113.936539
|
22.326475
|
|
8
|
811508
|
824254
|
113.936486
|
22.357241
|
|
9
|
812516
|
820892
|
113.946329
|
22.326894
|
|
9
|
812516
|
824254
|
113.946279
|
22.357255
|
|
10*
|
813525
|
818270
|
113.956156
|
22.303225
|
|
10*
|
813525
|
824657
|
113.956065
|
22.360912
|
|
11
|
814556
|
818449
|
113.966160
|
22.304858
|
|
11
|
814556
|
820992
|
113.966125
|
22.327820
|
|
12
|
815542
|
818807
|
113.975726
|
22.308109
|
|
12
|
815542
|
824882
|
113.975647
|
22.362962
|
|
13
|
816506
|
819480
|
113.985072
|
22.314192
|
|
13
|
816506
|
824859
|
113.985005
|
22.362771
|
|
14
|
817537
|
820220
|
113.995070
|
22.320883
|
|
14
|
817537
|
824613
|
113.995018
|
22.360556
|
|
15
|
818568
|
820735
|
114.005071
|
22.325550
|
|
15
|
818568
|
824433
|
114.005030
|
22.358947
|
|
16
|
819532
|
821420
|
114.014420
|
22.331747
|
|
16
|
819532
|
824209
|
114.014390
|
22.356933
|
|
17
|
820451
|
822125
|
114.023333
|
22.338117
|
|
17
|
820451
|
823671
|
114.023317
|
22.352084
|
|
18
|
821504
|
822371
|
114.033556
|
22.340353
|
|
18
|
821504
|
823761
|
114.033544
|
22.352903
|
|
19
|
822513
|
823268
|
114.043340
|
22.348458
|
|
19
|
822513
|
824321
|
114.043331
|
22.357971
|
|
20
|
823477
|
823402
|
114.052695
|
22.349680
|
|
20
|
823477
|
824613
|
114.052686
|
22.360610
|
|
21
|
805476
|
827081
|
113.877878
|
22.382668
|
|
21
|
805476
|
830562
|
113.877811
|
22.414103
|
|
22
|
806464
|
824033
|
113.887520
|
22.355164
|
|
22
|
806464
|
829598
|
113.887416
|
22.405423
|
|
23
|
814559
|
821739
|
113.966142
|
22.334574
|
|
23
|
814559
|
824768
|
113.966101
|
22.361920
|
5.4.5 *Remark: Due to the presence
of deployed silt curtain systems at the site boundaries of the Project, some of
the transect lines shown in Figure 5 could not be fully surveyed during the
regular survey. Transect 10 is reduced from 6.4km to approximately 3.6km in
length due to the HKBCF construction site. Therefore the total transect length
for both NEL and NWL combined is reduced to approximately 111km.
5.5.1 The study area
incorporates 23 transects which are to be surveyed twice per month. Each survey day lasts approximately 9
hours.
5.5.2 The survey vessel
departs from Tung Chung Development Pier, Tsing Yi Public Pier or the nearest
safe and convenient pier.
5.5.3 When the vessel
reaches the start of a transect line, ��on effort�� survey begins. Areas between
transect lines and traveling to and from the study area are defined as ��off
effort��.
5.5.4 The transect line is
surveyed at a speed of 6-8 knots (11-14 km/hr). For the sake of safety, the
speed was sometimes a bit slower to avoid collision with other vessels. During some periods, tide and current
flow in the survey areas exceeds 7 knots which can affect survey speed. There
are a minimum of four marine mammal observers (MMOs) present on each survey,
rotating through four positions, observers (2), data recorder (1) and ��rest��
(1). Rotations occur every 30 minutes or at the end of dolphin encounters. The data recorder records effort,
weather and sightings data directly onto the programme Logger and is not part of the observer team. The observers search with naked eye and
binoculars between 90�X and 270�X abeam (bow being 0�X).
5.5.5 When a group of
dolphins is sighted, position, bearing and distance data are recorded
immediately onto the computer and, after a short observation, an estimate made
of group size. These parameters are
linked to the time-GPS-ships data which are automatically stored in the
programme Logger throughout the survey period. In this manner, information on heading,
position, speed, weather, effort and sightings are stored in a format suitable
for use with DISTANCE software for subsequent line transect analyses.
5.5.6 Once the vessel
leaves the transect line, it is deemed to be ��off effort��. The dolphins are
approached with the purpose of taking high resolution pictures for proper
photo-identification of individual CWD.
Attempts to photograph all dolphins in the group are made. Both the left and right hand sides of
the dorsal fin area of each dolphin in the group are photographed, if
possible. On finishing
photographing, the vessel will return to the transect line at the point of
departure and ��on effort�� survey is resumed.
5.5.7 Sightings which are
made while on the transect line are referred to as "on effort
sightings", while not on the actual transect line are referred to as an ��opportunistic
sightings�� (e.g. another group of dolphins is sighted while travelling back to
the transect line). Only ��on effort
sightings�� can be used in analyses which require effort or rate quantification,
e.g., encounter rate per 100km searched.
This is also how ��on effort sightings�� are treated in the baseline
report. ��Opportunistic sightings��
provide additional information on individual habitat use and population
distribution and they are noted accordingly.
5.5.8 As time and GPS data
are automatically logged throughout the survey and are linked to sightings data
input, start and end times of encounters and deviation from the transect lines
are recorded and can be subsequently reviewed.
5.6.1 The schedule for
dolphin monitoring in November 2013 is provided in
Appendix F.
5.7.1 Dolphin surveys were
conducted on 1, 2, 7 and 9 November 2013. In summary, a total of 223.9km of survey was conducted. 1.2km effort was conducted on 2 November 2013 under sea condition Beaufort 4, nearly 99.46% of ��on effort�� survey was conducted under
favourable conditions (Beaufort Sea State 3 or better), i.e. 222.7km. The
details are shown below:-
5.7.2
The effort summary and sightings data are shown in Tables 5.3 and 5.4,
respectively. The survey efforts conducted in November 2013 are plotted in Figure 5a-c. For Table 5.3,
only on-effort information is included. Transects conducted in all Beaufort Sea
State are included. Compared to previous monthly reports, the whole number Beaufort
Sea State scale is used so as to ease comparison with other dolphin monitoring
reports.
Table 5.3 Impact Dolphin Monitoring Survey Effort Summary, Effort
by Area and Beaufort Sea State
|
Survey
|
Date
|
Area
|
Beaufort
|
Effort (km)
|
Total
Distance
Travelled (km)
|
|
1
|
01/11/2013
|
NEL
|
1
|
35.4
|
59.5
|
|
01/11/2013
|
NWL
|
1
|
14.6
|
|
01/11/2013
|
NWL
|
2
|
9.5
|
|
02/11/2013
|
NWL
|
2
|
26.7
|
52.2
|
|
02/11/2013
|
NWL
|
3
|
24.3
|
|
02/11/2013
|
NWL
|
4
|
1.2
|
|
2
|
07/11/2013
|
NWL
|
1
|
43.4
|
64.7
|
|
07/11/2013
|
NWL
|
2
|
21.3
|
|
09/11/2013
|
NEL
|
1
|
10.0
|
47.5
|
|
09/11/2013
|
NEL
|
2
|
21.2
|
|
09/11/2013
|
NEL
|
3
|
6.5
|
|
09/11/2013
|
NWL
|
1
|
3.7
|
|
09/11/2013
|
NWL
|
2
|
6.1
|
|
TOTAL in November 2013
|
223.9
|
*Remark: Surveys conduct under Beaufort Sea
State 3 or below are considered as under favourable condition.
Table 5.4 Impact Dolphin Monitoring Survey Details in November 2013
|
Date
|
Location
|
No. Sightings ��on effort��
|
No. Sightings ��opportunistic��
|
|
01/11/13
|
NW L
|
2
|
3
|
|
NEL
|
0
|
0
|
|
02/11/13
|
NW L
|
1
|
3
|
|
NEL
|
0
|
0
|
|
07/11/13
|
NW L
|
6
|
0
|
|
NEL
|
0
|
0
|
|
09/11/13
|
NW L
|
1
|
0
|
|
NEL
|
0
|
0
|
|
TOTAL in November 2013
|
10
|
6
|
Table 5.5 The Encounter Rate of Number of Dolphin Sightings & Total Number of Dolphins per Area^
|
Encounter Rate of Number
of Dolphin Sightings (STG)*
|
|
Date
|
NEL Track
|
NWL Track
|
NEL Sightings
|
NWL Sightings
|
NEL Encounter Rate
|
NWL Encounter Rate
|
|
1 & 2/11/2013
|
35.4 km
|
75.1 km
|
0
|
3
|
0.0
|
4.0
|
|
7 & 9/11/2013
|
37.7 km
|
74.5 km
|
0
|
7
|
0.0
|
9.4
|
|
Encounter Rate
of Total Number of Dolphins (ANI)**
|
|
Date
|
NEL Track
|
NWL Track
|
NEL Dolphins
|
NWL Dolphins
|
NEL Encounter Rate
|
NWL Encounter Rate
|
|
1 & 2/11/2013
|
35.4 km
|
75.1 km
|
0
|
16
|
0.0
|
21.3
|
|
7 & 9/11/2013
|
37.7 km
|
74.5 km
|
0
|
21
|
0.0
|
28.2
|
*
Encounter Rate of Number of Dolphin Sightings (STG) presents encounter rates in terms of groups per 100km.
** Encounter Rate of
Total Number of Dolphins (ANI) presents encounter rates
in terms of individuals per 100km. And the encounter rate is not corrected for
individuals, calculation may represent double counting.
^The table is made only for reference to the
quarterly STG & ANI, which were adopted for the Event & Action Plan.
5.7.3 A total of sixteen dolphin
sightings were recorded during the two surveys, five on 1 November 2013; four on
2 November 2013; six sightings were made on 7 November 2013 and one sighting
was made on 9 November 2013. Of the
sixteen sightings, ten were ��on effort�� (which are all under favourable
condition) and six were ��opportunistic��.
A total of fifty three individuals were sighted from the two impact
dolphin surveys in the reporting period. Sighting details are summarised and
plotted in Appendix K and Figure 5c, respectively.
5.7.4 Behaviour: Of the sixteen
sightings made, five sightings were recorded as ��multiple�� behavior (four as
travelling and feeding and one as feeding and surface active); eight sightings
were recorded as feeding; one was recorded as travelling and two sightings were
recorded as ��unknown��. The locations of sighting with different behaviour are
mapped in Figure 5d.
5.7.5 Photo ID analyses for November 2013 are underway (as of 16
December 2013) and will be presented in the monthly EM&A
Report for December 2013.
5.7.6 Photo ID analyses in September 2013 identified one dolphin which was a re-sighting (HZMB 002);
October 2013 identified thirteen dolphins, eight of which were
re-sightings (HZMB 002,
003, 005, 022, 040, 044, 054 and 098) and five of which
were new to the catalogue. Images are presented in Appendix
K.
5.7.7 Noteworthy Observation: Two mother and calf pairs were observed during
two separate encounters and presented in Figure 5e.
5.7.8 The event action plan is annexed
in Appendix L.
6.1
Site
Inspection
6.1.1 Site Inspections were
carried out on a weekly basis to monitor the implementation of proper
environmental pollution control and mitigation measures for the Project. In the
reporting month, 5 site inspections were carried
out on 7, 14, 21
and 28 November 2013.
6.1.2 Particular observations
during the site inspections are described below:
Air Quality
6.1.3 Sand surface was observed during
inspection at works area at Portion A. The Contractor provided dust control to
the areas with sand surface. The Contractor was reminded to continue the
provision of dust control measures to the areas with sand surface. (Reminder)
6.1.4 Dark smoke was observed emitted
on barges when sand material was being transferred to another barge. The Contractor
was reminded to rectify the situation such as to maintain their equipments in
good condition to prevent emission of dark smoke. The Contractor maintained
their equipments in good condition to prevent emission of dark smoke. (Closed)
6.1.5 Bags of cement was observed not
entirely covered by impervious sheeting, the Contractor was reminded to keep
the bags of cement covered entirely by impervious sheeting. the Contractor
rectified the situation and kept the bags of cement covered entirely by
impervious sheeting. (Closed)
Noise
6.1.6 A Generator was observed without
sufficient decoupling measures on barge Fai Yu 3228. The Contractor provided
sufficient acoustic decoupling measures to generator on Fai Yu 3228. (Closed)
6.1.7 Noise Emission Label (NEL) of an
air compressor was observed missing. The Contractor was reminded to properly
display the NEL on all Compressors. The Contractor properly display the NEL the
Compressors observed on Kiu Chi. (Closed)
Water Quality
6.1.8 Oil drum was observed improperly
stored on an area outside Contractor��s site office, at works area at Portion A,
Evershine 668, Fai Yu 3228, on barge Yat Fat and on temporary seawall. The
Contractor provided mitigation measures such as drip trays to contain any
potential oil leakage/spillage or removed the oil drums on Portion A, Evershine
668, Fai Yu 3228, on barge Yat Fat and on temporary seawall. (Closed)
6.1.9 Water was observed accumulate
inside car tyre on barge Yat Fat. The Contractor was reminded to keep the site
clean and tidy and clear the water accumulated inside car to prevent mosquito
breeding. The Contractor rectified the situation by clearing the car tyre on
barge Yat Fat. (Closed)
6.1.10 Oil stain was observed on barge
Yat Fat and on barge Kiu Chiu. The Contractor was reminded to clear the oil
stain using oil absorbent material and dispose the absorbent as chemical waste.
The Contractor cleared the oil stain observed on barge Yat Fat. (Closed)
6.1.11 Oil stain was observed on barge
Kiu Chiu. The Contractor was reminded to clear the oil stain using chemical
absorbent and dispose the chemical absorbent as chemical waste. The Contractor
cleared the oil stain on barge Kiu Chiu. (Closed)
6.1.12 Generators were observed without
drip tray on barge works area at portion A and on a steel cell. The Contractor
was reminded to provide sufficient drip trays to generators on works area at
portion A and on steel cell. The Contractor provided sufficient drip trays to
generators on works area at portion A and on steel cell. (Closed)
6.1.13 Defect was observed within a
bunding on barge Evershine 668. The Contractor was advised to rectify the
defects within the bunding on barge Evershine 668. The Contractor rectified the
defects within the bunding on barge Evershine 668. (Closed)
6.1.14 Barges were observed without
sufficient enclosed side curtain. The Contractor was reminded to provide barges
for delivering sand material with sufficient enclosed side curtain. The
Contractor was reminded to provide barges for delivering sand material with
enclosed side curtain. (Closed)
6.1.15 Hole was observed within the
frame of a drip tray of a boring machine and at Work Area of Portion A. The
Contractor properly sealed the hole within the frame of the drip trays. The oil
stain near the boring machine was cleared. The Contractor was reminded to
remove the oil stain and dispose the oil as chemical waste. (Reminder)
6.1.16 Turbid water was observed at the
southwestern silt curtain entrance area. Refer to the photo taken and site
observations, sources of impact likely due to the turbine activities and/or
movement of vessel at shallow water (at near the entrance at southwestern of
the Construction site and/or when vessel��s propeller was turn on at shallow
water). The dispersion of turbid water from the inside of the perimeter silt
curtain to the outside of the perimeter silt curtain is potentially due to
defects of perimeter silt curtain at certain sections and/or insufficient
overlapping at entrance/exit of the perimeter silt curtain. The Contractor was
advised to regularly evaluate the integrity of the perimeter silt curtain by
reviewing the results obtained from daily checking or/and monthly diver
inspections specified by the Silt Curtain Deployment Plan. The Contractor was
advised to provide sufficient mitigation measures and swiftly carry out
maintenance once defects of the perimeter silt curtain are found during the
above mentioned daily checking and/or monthly diver inspection. (Follow up)
Chemical and Waste
Management
6.1.17 Litter and general
refuse was observed accumulated on sea the Contractor was reminded to
avoid/clear any foam, oil, grease, chemicals, litter, food or other
objectionable matter due to the Project works presented in the water within and
adjacent to the works site. The Contractor avoided any foam, oil, grease,
chemicals, litter, food or other objectionable matter due to the Project works
presented in the water within and adjacent to the works site. The Contractor
was reminded to collect and clear the waste on sea regularly. (Closed)
6.1.18 General refuse were
found on various location of the works area at Portion A. The Contractor was
reminded to clear the general refuse regularly. The Contractor was reminded to
maintain the site in a clean and tidy condition i.e. to properly store the
general refuse at designated waste storage area(s). The Contractor cleared the
general maintain the site in a clean and tidy condition. (Closed)
Landscape and Visual
Impact
6.1.19 No relevant works was
carried out in the reporting month.
Others
6.1.20 Rectifications of
remaining identified items are undergoing by the Contractor. Follow-up inspections
on the status on provision of mitigation measures will be conducted to ensure
all identified items are mitigated properly.
6.2.1 The Contractor had
registered as a chemical waste producer for this Project. Receptacles were
available for general refuse collection and sorting.
6.2.2 As advised by the
Contractor, 797,293m3 of fill were
imported for the Project use in the reporting period. 0.196
tonnes of paper/ carboard packaging was generated and 19.5m3 of general refuse were
generated and disposed of in the reporting period. Monthly summary of waste
flow table is detailed in Appendix M.
6.2.3 The Contractor is
advised to properly maintain on site C&D materials and wastes storage,
collection, sorting and recording system, dispose of C&D materials and
wastes at designated ground and maximize reuse / recycle of C&D materials
and wastes. The Contractor is reminded to properly maintain the site tidiness
and dispose of the wastes accumulated on site regularly and properly.
6.2.4 The Contractor is
reminded that chemical waste should be properly treated and stored temporarily
in designated chemical waste storage area on site in accordance with the Code
of Practice on the Packaging, Labeling and Storage of Chemical Wastes.
6.3
Environmental
Licenses and Permits
6.3.1 The environmental
licenses and permits for the Project and valid in the reporting month is
summarized in Table 6.1.
6.3.2 As informed by the Contractor, a CNP application submitted on 30
October 2013 was approved and the permit was issued on 12 November 2013
Table 6.1 Summary of Environmental Licensing and Permit Status
|
Statutory Reference
|
License/ Permit
|
License or Permit No.
|
Valid Period
|
License/ Permit Holder
|
Remarks
|
|
From
|
To
|
|
EIAO
|
Environmental
Permit
|
EP-353/2009/G
|
06/08/2012
|
N/A
|
HyD
|
Hong
Kong �V Zhuhai �V Macao Bridge Hong Kong Boundary Crossing Facilities
|
|
EP-354/2009/A
|
08/12/2010
|
N/A
|
Tuen
Mun �V Chek Lap Kok Link (TMCLKL Southern Landfall Reclamation only)
|
|
APCO
|
NA
notification
|
--
|
30/12/2011
|
--
|
CHEC
|
Works
Area WA2 and WA3
|
|
APCO
|
NA
notification
|
--
|
17/01/2012
|
--
|
CHEC
|
Works
Area WA4
|
|
WDO
|
Chemical
Waste Producer Registration
|
5213-951-C1186-21
|
30/3/2012
|
N/A
|
CHEC
|
Chemical
waste produced in Contract HY/2010/02
|
|
WDO
|
Chemical
Waste Producer Registration
|
5213-974-C3750-01
|
31/10/2012
|
--
|
CHEC
|
Registration
as Chemical Waste Producer at To Kau Wan(WA4)
|
|
WDO
|
Chemical
Waste Producer Registration
|
5213-839-C3750-02
|
13/09/2012
|
--
|
CHEC
|
Registration
as Chemical Waste Producer at TKO 137(FB)
|
|
WDO
|
Billing Account for Disposal of
Construction
Waste
|
7014181
|
05/12/2011
|
N/A
|
CHEC
|
Waste
disposal in Contract HY/2010/02
|
|
NCO
|
Construction
Noise Permit
|
GW-RE0634-13
|
24/06/2013
|
31/12/2013
|
CHEC
|
Works Area WA4 in Contract
HY/2010/02
|
|
NCO
|
Construction
Noise Permit
|
GW-RS1279-13
|
12/11/2013
|
11/01/2014
|
CHEC
|
Reclamation Works in Contract
HY/2010/02
|
|
NCO
|
Construction
Noise Permit
|
GW-RW0424-13
|
28/06/2013
|
27/12/2013
|
CHEC
|
Section of TKO Fill Bank under Contract
HY/2010/02
|
6.4.1 In response to the site
audit findings, the Contractors carried out corrective actions.
6.4.2 A summary of the
Implementation Schedule of Environmental Mitigation Measures (EMIS) is
presented in Appendix C. Most of the necessary mitigation measures were
implemented properly.
6.4.3 Training of marine
travel route for marine vessels operator was given to relevant staff and
relevant records were kept properly.
6.4.4 Regarding the
implementation of dolphin monitoring and protection measures (i.e.
implementation of Dolphin Watching Plan, Dolphin Exclusion Zone and Silt
Curtain integrity Check), regular checking were conducted by the experienced
MMOs within the works area to ensure no dolphin was trapped by the enclosed
silt curtain systems. Any dolphin spotted within the enclosed silt curtain systems
was reported and recorded. Relevant procedures were followed and measures were
well implemented. Silt curtain systems were also inspected timely in accordance
to the submitted plan. All inspection records were kept properly.
6.4.5 Acoustic decoupling
measures on noisy plants on construction vessels were checked regularly and the Contractor was reminded to ensure provision of ongoing maintenance
to noisy plants and to carry out improvement work once insufficient acoustic
decoupling measures were found.
6.5
Summary
of Exceedances of the Environmental Quality Performance Limit
6.5.1 Two (2) 24-hour TSP results recorded at AMS3A exceeded the
Action Level and one (1) 24-hour TSP results recorded at AMS3A exceeded the Limit Level in the reporting month. Investigation results
show that the exceedances were not related to Project. All 1-Hour TSP results were below the Action
and Limit Level in the reporting month.
6.5.2 For construction
noise, no exceedance was recorded at all monitoring stations in the reporting
period.
6.5.3 Fifteen (15) Action
Level Exceedances were recorded at measured suspended solids (SS) values (in
mg/L) in the reporting month. No Limit Level exceedances were recorded at
measured suspended solids (SS) values (in mg/L) in the reporting month.
6.5.4 Two (2) action level exceedances were noted and the investigation and undergoing
and results will be reported in the quarterly EM&A report (Sept 13 �V Nov
13).
6.5.5 Cumulative statistics
on exceedance is provided in Appendix N.
6.6
Summary
of Complaints, Notification of Summons and Successful Prosecutions
6.6.1 The Environmental
Complaint Handling Procedure is annexed in Figure 6.
6.6.2 As informed by the
Contractor on 5 Nov 13, a noise complaint received on 14 Sept 13 was referred
to the Contractor of HKBCF on 1 Nov 13. The captioned complaint involves noise
generated by a tug boat operating near a pier at Tung Chung around
05:55am-06:45am on 14 Sept 13. In respect of the concern incident, the
Contractor of HKBCF confirmed that the tug boat showed in the photographs provided does not belong to this project. As a result, the noise complaint was
considered as non-project related
6.6.3 As informed by the
Contractor on 5 Dec13, one complaint was noted on 12 Nov regarding a barge
moving through the southern channel. (Investigation is undergoing as on 6
December 13.)
6.6.4 As informed by the
Contractor, complaint received from Penta-Ocean �V Gitanes Joint Venture
(CV/2012/03) mentioned that the formation works of the Contaminated Mud Pit
CMP1 to the South of the Brothers (CMP1 of SB) which has been completed in
mid-August 2013 and the pit has been commissioned for receiving contaminated
marine mud from other projects starting from 16 August 2013. However, it was
recently observed that some of the project vessels of HY/2010/02 (photos taken
on 20 Nov 2013 are attached) had berthed within the said pit and those
anchorages would likely cause disruption to the underlying contaminated mud and
thus induce unfavourable contamination impact to the surrounding marine
environment. In this regard, they reminded the contractor to avoid berthing of
their vessels within the boundary of CMP1 of SB thereafter for the sake of
environmental concern. (Investigation is undergoing as on 6 December 13.)
6.6.5 No notification of summons and successful prosecutions
was received in the reporting period.
6.6.6 Statistics on
complaints, notifications of summons and successful prosecutions are summarized
in Appendix N.
7
FUTURE KEY ISSUES
7.1.1 As informed by the
Contractor, the major works for the Project in November and December 2013 will be:-
Marine-based Works
-
Marine-base
-
Cellular structure installation
-
Connecting arc cell installation
-
Laying geo-textile
-
Sand blanket laying
-
Sand filling
-
Maintenance of silt curtain & silt screen at sea water
intake of HKIA
-
Stone column installation
-
Band drain installation
-
Backfill cellular structure
-
Geotechnical Instrumentation works
-
Construction of temporary seawall
-
Ground investigation
-
Construction of conveyors for public fill
-
Surcharge laying
-
Construction of temporary assess from Portion D to Portion A
-
Precast Yard for seawall blocks and culverts
Land-based Works
-
Maintenance works of Site Office at Works Area WA2
-
Maintenance works of Public Works Regional Laboratory
at Works Area WA3
-
Geo-textile fabrication at Works Area WA2
-
Installed sand bag at Works Area WA2
-
Silt curtain fabrication at Works Area WA4
-
Maintenance of Temporary Marine Access at Works Area WA2
7.2
Key Issues
for the Coming Month
7.2.1 Key issues to be
considered in the coming months:-
-
Site runoff should be properly
collected and treated prior to discharge;
-
Minimize loss of sediment from filling
works;
-
Regular review and maintenance of silt
curtain systems, drainage systems and desilting facilities;
-
Exposed surfaces/soil stockpiles should
be properly treated to avoid generation of silty surface run-off during
rainstorm;
-
Regular review and maintenance of wheel
washing facilities provided at all site entrances/exits;
-
Conduct regular inspection of various
working machineries and vessels within works areas to avoid any dark smoke
emission;
-
Suppress dust generated from work
processes with use of bagged cements, earth movements, excavation activities,
exposed surfaces/soil stockpiles and
haul road traffic;
-
Quieter powered mechanical equipment should
be used;
-
Provision of proper and effective noise
control measures for operating equipment and machinery on-site, such as
erection of movable noise barriers or enclosure for noisy plants;
-
Closely check and replace the sound
insulation materials regularly;
-
Better scheduling of construction works
to minimize noise nuisance;
-
Properly store and label oil drums and
chemical containers placed on site;
-
Proper chemicals, chemical wastes and
wastes management;
-
Maintenance works should be carried out
within roofed, paved and confined areas;
-
Collection and segregation of
construction waste and general refuse on land and in the sea should be carried
out properly and regularly; and
- Proper
protection and regular inspection of existing trees, transplanted/retained trees.
7.3
Monitoring
Schedule for the Coming Month
7.3.1
The
tentative schedule for environmental monitoring in November
2013 is provided in Appendix F.
8.1.1 The construction
phase and EM&A programme of the Project commenced on 12 March 2012.
8.1.2 All 1-Hour TSP
results were below the Action and Limit Level in the reporting month. Two (2) 24-hour TSP results recorded at AMS3A exceeded the
Action Level and one (1) 24-hour TSP results recorded at AMS3A exceeded the Limit Level in the reporting month. Investigation results show that the exceedances were not
related to Project.
8.1.3 For construction
noise, no exceedance was recorded at all monitoring stations in the reporting
period.
8.1.4 Fifteen (15) Action
Level Exceedances were recorded at measured suspended solids (SS) values (in
mg/L) in the reporting month. No Limit Level exceedances were recorded at
measured suspended solids (SS) values (in mg/L) in the reporting month.
8.1.5 A total of sixteen
dolphin sightings were recorded during the two surveys, five on 1 November
2013; four on 2 November 2013; six sightings were made on 7 November 2013 and
one sighting was made on 9 November 2013.
Of the sixteen sightings, ten were ��on effort�� (which are all under favourable
condition) and six were ��opportunistic��.
A total of fifty three individuals were sighted from the two impact
dolphin surveys in the reporting period. Sighting details are summarised and
plotted in Appendix K and Figure 5c, respectively.
8.1.6 Behaviour: Of the
sixteen sightings made, five sightings were recorded as ��multiple�� behavior
(four as travelling and feeding and one as feeding and surface active); eight
sightings were recorded as feeding; one was recorded as travelling and two
sightings were recorded as ��unknown��. The locations of sighting with different
behaviour are mapped in Figure 5d.
8.1.7 Two action level
exceedances were noted and the investigation and undergoing and results will be
reported in the quarterly EM&A report (Sept 13 �V Nov 13).
8.1.8 Environmental site
inspection was carried out 4 times in November 2013. Recommendations on remedial actions were given to the Contractors
for the deficiencies identified during the site audits.
8.1.10
As informed by the Contractor on 5 Dec13, one complaint was noted on 12 Nov
regarding a barge moving through the southern channel. (Investigation is
undergoing as on 6 December 13.)
8.1.11
As informed by the Contractor, complaint received from Penta-Ocean �V
Gitanes Joint Venture (CV/2012/03) mentioned that the formation works of the Contaminated
Mud Pit CMP1 to the South of the Brothers (CMP1 of SB) which has been completed
in mid-August 2013 and the pit has been commissioned for receiving contaminated
marine mud from other projects starting from 16 August 2013. However, it was
recently observed that some of the project vessels of HY/2010/02 (photos taken
on 20 Nov 2013 are attached) had berthed within the said pit and those
anchorages would likely cause disruption to the underlying contaminated mud and
thus induce unfavourable contamination impact to the surrounding marine
environment. In this regard, they reminded the contractor to avoid berthing of
their vessels within the boundary of CMP1 of SB thereafter for the sake of
environmental concern. (Investigation is undergoing as on 6 December 13.)
8.1.12
No notification of summons and
successful prosecution was received in the reporting period.
8.2.1 According to the
environmental site inspections performed in the reporting month, the following
recommendations were provided:
Air Quality
Impact
l All working plants and vessels on site should be regularly inspected and
properly maintained to avoid dark smoke emission.
l All vehicles should
be washed to remove any dusty materials before leaving the site.
l Haul roads should be
sufficiently dampened to minimize fugitive dust generation.
l Wheel washing
facilities should be properly maintained and reviewed to ensure properly
functioning.
l Temporary exposed
slopes and open stockpiles should be properly covered.
l Enclosure should be
erected for cement debagging, batching and mixing operations.
l Water spraying should be provided to suppress fugitive dust for any dusty
construction activity.
Construction
Noise Impact
l Quieter powered mechanical equipment should be used as far as possible.
l Noisy operations should be oriented to a direction away from sensitive
receivers as far as possible.
l Proper and effective noise control measures for operating equipment and
machinery on-site should be provided, such as erection of movable noise
barriers,
enclosure for noisy plants or enhancement
works to provide sufficient acoustic decoupling measure(s). Closely check and replace the sound insulation materials regularly
l Vessels and equipment operating should be checked regularly and properly
maintained.
l Noise Emission Label (NEL) shall be affixed to the air compressor and
hand-held breaker operating within works area.
l Acoustic decoupling measures should be properly implemented for all existing and incoming construction vessels
with continuous and regularly checking to ensure effective implementation of acoustic decoupling measures.
Water Quality
Impact
l Regular review and maintenance of silt curtain systems, drainage systems
and desilting facilities in order to make sure they are functioning
effectively.
l Construction of seawall should be completed as early as possible.
l Regular inspect and review the loading process from barges to avoid
splashing of material.
l Silt, debris and leaves accumulated at public drains, wheel washing bays
and perimeter u-channels and desilting facilities should be cleaned up
regularly.
l Silty effluent should be treated/ desilted before discharged. Untreated
effluent should be prevented from entering public drain channel.
l Proper drainage channels/bunds should be provided at the site boundaries
to collect/intercept the surface run-off from works areas.
l Exposed slopes and stockpiles should be covered up properly during
rainstorm.
Chemical and
Waste Management
l All types of wastes, both on land and floating in the sea, should be
collected and sorted properly and disposed of timely and properly. They should
be properly stored in designated areas within works areas temporarily.
l All chemical containers, batteries and oil drums should be properly
stored and labelled.
l All plants and vehicles on site should be properly maintained to prevent
oil leakage. Proper measures,
like drip trays and/or bundings, should be provided for retaining leaked
oil/chemical from plants.
l All kinds of maintenance works should be carried out within roofed,
paved and confined areas.
l All drain holes of the drip trays utilized within works areas should be
properly plugged to avoid any oil and chemical waste leakage.
l Oil stains on soil surface, accumulated oil mixture and empty chemical
containers should be cleared and disposed of as chemical waste.
l Regular review should be conducted for
working barges and patrol boats to ensure sufficient measures and spill control
kits were provided on working barges and patrol boats to avoid any spreading of
leaked oil/chemicals.
Landscape and
Visual Impact
l All existing, retained/transplanted trees at the works areas should be
properly fenced off and regularly inspected.