TABLE OF CONTENTS
Page
1.4 Summary of Construction Works
2 Summary of EM&A Programme Requirements
2.2 Environmental Quality Performance (Action/Limit Levels)
2.3 Environmental Mitigation Measures
3.5 Environmental Site Inspection and Audit
4 Advice on the Solid and Liquid Waste Management Status
4.1 Summary of Solid and Liquid Waste Management
5 Implementation Status of Environmental Mitigation Measures
5.1 Implementation Status of Environmental Mitigation Measures
6 Summary of Exceedances of the Environmental Quality Performance Limit
6.1 Summary of Exceedances of the Environmental Quality Performance Limit
7 Summary of Complaints, Notification of Summons and Successful Prosecutions
7.1 Summary of Environmental Compliants, Notification of Summons and Successful Prosecutions
8 Comments, recommendations and Conclusions
8.1 Comments on mitigation measures 44
8.2 Recommendations on EM&A Programme
List of Tables
Table 1.1 Contact Information of Key Personnel
Table 3.1 Summary of Number of Monitoring Events for 1-hr & 24-hr TSP Concentration
Table 3.2 Summary of Number of Exceedances for 1-hr & 24-hr TSP Monitoring
Table 3.3 Summary of Number of Monitoring Events for Impact Noise
Table 3.4 Summary of Number of Monitoring Exceedances for Impact Noise
Table 3.5 Summary of Water Quality Exceedances in March-May 2013
Table 3.6 Summary of Key Dolphin Survey Findings in Mar 2013- May 2013
Table 3.7 Summary of STG and ANI encounter rates in Mar 2013- May 2013
Figures
Figure 1 General Project Layout Plan
Figure 2 Impact Air Quality and Noise Monitoring Stations and Wind Station
Figure 3 Impact Water Quality Monitoring Stations
Figure 4 Impact Dolphin Monitoring Line Transect Layout Map
Figure 5 Environmental Complaint Handling Procedure
List of Appendices
Appendix A Project Organization for Environmental Works
Appendix B Three Month Rolling Construction Programmes
Appendix C Implementation Schedule of Environmental Mitigation Measures (EMIS)
Appendix D Summary of Action and Limit Levels
Appendix E Graphical Presentation of Impact Air Quality Monitoring Results
Appendix F Graphical Presentation of Impact Daytime Construction Noise Monitoring Results
Appendix G Graphical Presentation of Impact Water Quality Monitoring Results
Appendix H Impact Dolphin Monitoring Survey Findings and Analysis
Appendix I Quarterly Summary of Waste Flow Table
EXECUTIVE SUMMARY
Contract No. HY/2010/02 �V Hong Kong-Zhuhai-Macao Bridge Hong Kong Boundary Crossing Facilities �V Reclamation Work (here below, known as ��the Project��) mainly comprises reclamation at the northeast of the Hong Kong International Airport of an area of about 130-hectare for the construction of an artificial island for the development of the Hong Kong Boundary Crossing Facilities (HKBCF), and about 19-hectare for the southern landfall of the Tuen Mun - Chek Lap Kok Link (TMCLKL). It is a designated project and is governed by the current permits for the Project, i.e. the amended Environmental Permits (EPs) issued on 24 April 2013 (EP-353/2009/F) and 8 December 2011 (EP-354/2009/A) (for TMCLKL Southern Landfall Reclamation only).
Ove Arup & Partners Hong Kong Limited (Arup) was appointed by Highways Department (HyD) as the consultants for the design and construction assignment for the Project��s reclamation works (i.e. the Engineer for the Project).
China Harbour Engineering Company Limited (CHEC) was awarded by HyD as the Contractor to undertake the construction work of the Project.
ENVIRON Hong Kong Ltd. was employed by HyD as the Independent Environmental Checker (IEC) and Environmental Project Office (ENPO) for the Project.
AECOM Asia Co. Ltd. (AECOM) was appointed by CHEC to undertake the role of Environmental Team for the Project for carrying out the environmental monitoring and audit (EM&A) works.
The construction phase of the Project under the EPs was commenced on 12 March 2012 and will be tentatively completed by early Year 2016. The EM&A programme, including air quality, noise, water quality and dolphin monitoring and environmental site inspections, was commenced on 12 March 2012.
This report documents the findings of EM&A works conducted in the period between 1 March 2013 and 31 May 2013. As informed by the Contractor, major activities in the reporting quarter were:-
Marine-based Works
- Cellular structure installation
- Connecting arc cell installation
- Laying geo-textile
- Sand blanket laying
- Maintenance of silt curtain
- Stone column installation
- Laying stone blanket
- Band drain installation
- Backfill cellular structure
- Instrumentation works
- Construction of temporary seawall
- Ground investigation
- Installation of silt screen at sea water intake of HKIA
Land-based Works
- Maintenance works of Site Office at Works Area WA2
- Maintenance works of Public Works Regional Laboratory at Works Area WA3
- Geo-textile fabrication at Works Area WA2
- Silt curtain fabrication at Works Area WA4
- Erection of site office for CHEC(GD) at Works Area WA2
- Green roof construction at Works Area WA2
- Construction of Temporary Marine Access at Works Area WA2
A summary of monitoring and audit activities conducted in the reporting quarter is listed below:
|
24-hour Total Suspended Particulates (TSP) monitoring 1-hour TSP monitoring |
16 sessions 16 sessions |
|
Noise monitoring |
12 sessions |
|
Impact water quality monitoring |
39 sessions |
|
Impact dolphin monitoring |
6 surveys |
|
Joint Environmental site inspection |
13 sessions |
Breaches of Action and Limit Levels for Air Quality
One (1) 24-hour TSP results exceeded the Action Level at monitoring station AMS7, three (3) 24-hour TSP results exceeded the Action Level at monitoring station AMS3A and two (2) 24-hour TSP result exceeded the Limit Level at monitoring station AMS3A. The investigation results showed that the action and limit level exceedances were non-project related. All 1-hour TSP results were below the Action and Limit Level at all monitoring locations in the reporting quarter.
Breaches of Action and Limit Levels for Noise
Due to one documented complaint is received; one (1) Action Level Exceedance of construction noise was recorded in the reporting quarter. The investigation results show that the action level exceedance was non-project related. No Limit Level Exceedance of construction noise was recorded in the reporting quarter.
Breaches of Action and Limit Levels for Water Quality
Ten (10) Action Level exceedances were recorded at measured suspended solids (SS) values (in mg/L) in the reporting quarter, one (1) Limit Level exceedance was recorded at measured suspended solids (SS) values (in mg/L) in the reporting quarter and 1 Action Level exceedance was recorded at turbidity (NTU) in the reporting quarter. Investigation result show that the exceedances were not due to the Project works.
Breaches of Action and Limit Levels for Impact Dolphin Monitoring
One (1) Limit level exceedance was recorded in the reporting quarter. The investigation results showed that there is no evidence that exceedances are related to Project works are annexed in Appendix L.
Triggering of Event and Action Plan for Impact Dolphin Monitoring
No Triggering of Event and Action Plan for Impact Dolphin Monitoring.
Implementation Status and Review of Environmental Mitigation Measures
Most of the recommended mitigation measures, as included in the EM&A programme, were implemented properly in the reporting quarter. Reference is made to ET��s proposal of the omission of air monitoring station (AMS 6) dated on 1 November 2012 and EPD��s letter dated on 19 November 2012 regarding the conditional approval of the proposed omission of air monitoring station (AMS 6) for Contract No. HY/2010/02. The aforesaid omission of Monitoring Station AMS6 was effective since 19 November 2012.
The recommended environmental mitigation measures effectively minimize the potential environmental impacts from the Project. The EM&A programme effectively monitored the environmental impacts from the construction activities and ensure the proper implementation of mitigation measures. No particular recommendation was advised for the improvement of the programme.
Moreover, regular review and checking on the construction methodologies, working processes and plants were carried out to ensure the environmental impacts were kept minimal and recommended environmental mitigation measures were implemented effectively.
Complaint, Notification of Summons and Successful Prosecution
Four (4) environmental complaints and one (1) summons was received were received in the reporting quarter.
No successful prosecution was received were received in the reporting quarter.
1
introduction
1.1 Background
1.1.1 Contract No. HY/2010/02 �V Hong Kong-Zhuhai-Macao Bridge Hong Kong Boundary Crossing Facilities �V Reclamation Work (here below, known as ��the Project��) mainly comprises seawall construction and reclamation at the northeast of the Hong Kong International Airport of an area of about 130-hectare for the construction of an artificial island for the development of the Hong Kong Boundary Crossing Facilities (HKBCF), and about 19-hectare for the southern landfall of the Tuen Mun - Chek Lap Kok Link (TMCLKL).
1.1.2 The environmental impact assessment (EIA) reports (Hong Kong �V Zhuhai �V Macao Bridge Hong Kong Boundary Crossing Facilities �V EIA Report (Register No. AEIAR-145/2009) (HKBCFEIA) and Tuen Mun �V Chek Lap Kok Link �V EIA Report (Register No. AEIAR-146/2009) (TMCLKLEIA), and their environmental monitoring and audit (EM&A) Manuals (original EM&A Manuals), for the Project were approved by Environmental Protection Department (EPD) in October 2009.
1.1.3 EPD subsequently issued the Environmental Permit (EP) for HKBCF in November 2009 (EP-353/2009) and the Variation of Environmental Permit (VEP) in June 2010 (EP-353/2009/A), November 2010 (EP-353/2009/B), November 2011 (EP-353/2009/C), March 2012 (EP-353/2009/D), October 2012 (EP-353/2009/E) and April 2013 (EP-353/2009/F). Similarly, EPD issued the Environmental Permit (EP) for TMCLKL in November 2009 (EP-354/2009) and the Variation of Environmental Permit (VEP) in December 2010 (EP-354/2009/A).
1.1.4 The Project is a designated project and is governed by the current permits for the Project, i.e. the amended EPs issued on 24 April 2013 (EP-353/2009/F) and 8 December 2011 (EP-354/2009/A) (for TMCLKL Southern Landfall Reclamation only).
1.1.5 A Project Specific EM&A Manual, which included all project-relation contents from the original EM&A Manuals for the Project, was issued in May 2012.
1.1.6 Ove Arup & Partners Hong Kong Limited (Arup) was appointed by Highways Department (HyD) as the consultants for the design and construction assignment for the Project��s reclamation works (i.e. the Engineer for the Project).
1.1.7 China Harbour Engineering Company Limited (CHEC) was awarded by HyD as the Contractor to undertake the construction work of the Project.
1.1.8 ENVIRON Hong Kong Ltd. was employed by HyD as the Independent Environmental Checker (IEC) and Environmental Project Office (ENPO) for the Project.
1.1.9 AECOM Asia Co. Ltd. (AECOM) was appointed by CHEC to undertake the role of Environmental Team for the Project for carrying out the EM&A works.
1.1.10 The construction phase of the Project under the EPs was commenced on 12 March 2012 and will be tentatively completed by early Year 2016.
1.1.11 According to the Project Specific EM&A Manual, there is a need of an EM&A programme including air quality, noise, water quality and dolphin monitoring and environmental site inspections. The EM&A programme of the Project commenced on 12 March 2012.
1.2 Scope of Report
1.2.1 This is
the fifth quarterly EM&A Report under the Contract No. HY/2010/02 Hong Kong-Zhuhai-Macao
Bridge Hong Kong
Boundary Crossing Facilities �V Reclamation Works. This report presents a
summary of the environmental monitoring and audit works, list of activities and
mitigation measures proposed by the ET for the Project from 1 March 2013 and 31
May 2013.
1.3 Project Organization
1.3.1 The project organization structure is shown in Appendix A. The key personnel contact names and numbers are summarized in Table 1.1.
Table 1.1 Contact Information of Key Personnel
|
Party |
Position |
Name |
Telephone |
Fax |
|
Engineer��s Representative (ER) (Ove Arup & Partners Hong Kong Limited) |
Chief Resident Engineer |
Roger Marechal |
2528 3031 |
2668 3970 |
|
IEC / ENPO (ENVIRON Hong Kong Limited) |
Independent Environmental Checker |
Raymond Dai |
3743 0788 |
3548 6988 |
|
Environmental Project Office Leader |
Y.H. Hui |
3743 0788 |
3548 6988 |
|
|
Contractor
(China Harbour Engineering Company Limited) |
General Manager (S&E) |
Daniel Leung |
3157 1086 |
2578 0413 |
|
Environmental Officer |
C. M. Wong |
3157 1086 |
2578 0413 |
|
|
24-hour Hotline |
Alan C.C. Yeung |
9448 0325 |
-- |
|
|
ET (AECOM Asia Company Limited) |
ET Leader |
Echo Leong |
3922 9280 |
2317 7609 |
1.4 Summary of Construction Works
1.4.1 The construction phase of the Project under the EP commenced on 12 March 2012.
1.4.2 As informed by the Contractor, details of the major works carried out in the reporting quarter are listed below:-
Marine-based Works
- Cellular structure installation
- Connecting arc cell installation
- Laying geo-textile
- Sand blanket laying
- Maintenance of silt curtain
- Stone column installation
- Laying stone blanket
- Band drain installation
- Backfill cellular structure
- Instrumentation works
- Construction of temporary seawall
- Ground investigation
- Installation of silt screen at sea water intake of HKIA
Land-based Works
- Maintenance works of Site Office at Works Area WA2
- Maintenance works of Public Works Regional Laboratory at Works Area WA3
- Geo-textile fabrication at Works Area WA2
- Silt curtain fabrication at Works Area WA4
- Erection of site office for CHEC(GD) at Works Area WA2
- Green roof construction at Works Area WA2
- Construction of Temporary Marine Access at Works Area WA2
1.4.3 The 3-month rolling construction programme of the Project is shown in Appendix B.
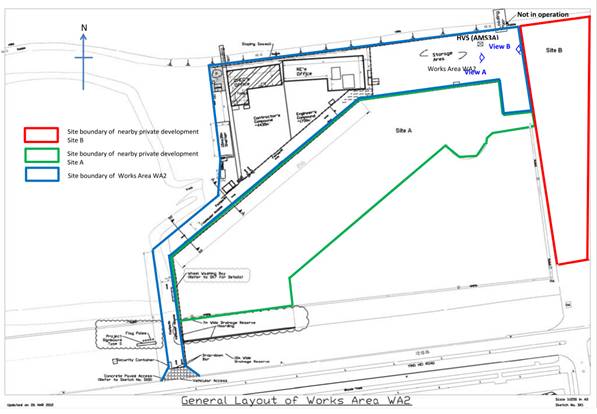
1.4.4 The general layout plan of the Project site showing the detailed works areas is shown in Figure 1.
1.4.5 The environmental mitigation measures implementation schedule are presented in Appendix C.
2
Summary of EM&A
Programme Requirements
2.1 Monitoring Parameters
2.1.1 The Project Specific EM&A Manual designated 4 air quality monitoring stations, 2 noise monitoring stations, 21 water monitoring stations (9 Impact Stations, 7 Sensitive Receiver Stations and 5 Control/Far Field Stations) to monitor environmental impacts on air quality, noise and water quality respectively. Pre-set and fixed transect line vessel based dolphin survey was required in two AFCD designated areas (Northeast and Northwest Lantau survey areas). The impact dolphin monitoring at each survey area should be conducted twice per month.
2.1.2 For impact air quality monitoring, monitoring locations AMS2 (Tung Chung Development Pier) and AMS7 (Hong Kong SkyCity Marriott Hotel) were set up at the proposed locations in accordance with Project Specific EM&A Manual. The conditional omission of Monitoring Station AMS6 was effective since 19 November 2012. For monitoring location AMS3 (Ho Yu College), as proposed in the Project Specific EM&A Manual, approval for carrying out impact monitoring could not be obtained from the principal of the school. Permission on setting up and carrying out impact monitoring works at nearby sensitive receivers, like Caribbean Coast and Coastal Skyline, was also sought. However, approvals for carrying out impact monitoring works within their premises were not obtained. Impact air quality monitoring was conducted at site boundary of the site office area in Works Area WA2 (AMS3A) respectively. Same baseline and Action Level for air quality, as derived from the baseline monitoring data recorded at Ho Yu College, was adopted for this alternative air quality location.
2.1.3 For impact noise monitoring, monitoring locations NMS2 (Seaview Crescent Tower 1) was set up at the proposed locations in accordance with Project Specific EM&A Manual. However, for monitoring location NMS3 (Ho Yu College), as proposed in the Project Specific EM&A Manual, approval for carrying out impact monitoring could not be obtained from the principal of the school. Permission on setting up and carrying out impact monitoring works at nearby sensitive receivers, like Caribbean Coast and Coastal Skyline, was also sought. However, approvals for carrying out impact monitoring works within their premises were not obtained. Impact noise monitoring was conducted at site boundary of the site office area in Works Area WA2 (NMS3A) respectively. Same baseline noise level, as derived from the baseline monitoring data recorded at Ho Yu College was adopted for this alternative noise monitoring location.
2.1.4 In accordance with the Project Specific EM&A Manual, twenty-one stations were designated for impact water quality monitoring. The nine Impact Stations (IS) were chosen on the basis of their proximity to the reclamation and thus the greatest potential for water quality impacts, the seven Sensitive Receiver Stations (SR) were chosen as they are close to the key sensitive receives and the five Control/ Far Field Stations (CS) were chosen to facilitate comparison of the water quality of the IS stations with less influence by the Project/ ambient water quality conditions.
2.1.5 Due to safety concern and topographical condition of the original locations of SR4 and SR10B, alternative impact water quality monitoring stations, naming as SR4(N) and SR10B(N), were adopted, which are situated in vicinity of the original impact water quality monitoring stations (SR4 and SR10B) and could be reachable. Same baseline and Action Level for water quality, as derived from the baseline monitoring data recorded, were adopted for these alternative impact water quality monitoring stations.
2.1.6 The monitoring locations used during the reporting quarter are depicted in Figures 2, 3 and 4 respectively.
2.1.7 The Project Specific EM&A Manual also required environmental site inspections for air quality, noise, water quality, chemical, waste management, marine ecology and landscape and visual impact.
2.2 Environmental Quality Performance (Action/Limit Levels)
2.2.1 The environmental quality performance limits (i.e. Action and/or Limit Levels) of air and water quality monitoring were derived from the baseline air and water quality monitoring results at the respective monitoring stations, while the environmental quality performance limits of noise monitoring were defined in the EM&A Manual.
2.2.2 The environmental quality performance limits of air quality, noise and water monitoring are given in Appendix D.
2.3 Environmental Mitigation Measures
2.3.1 Relevant environmental mitigation measures were stipulated in the Particular Specification and EPs (EP-353/2009/F and EP-354/2009/A) (for TMCLKL Southern Landfall Reclamation only) for the Contractor to adopt. A list of environmental mitigation measures and their implementation statuses are given in Appendix C.
3
MONITORING Results
3.1 Air Quality Monitoring
3.1.1 In accordance with the Project Specific EM&A Manual, impact 1-hour Total Suspended Particulates (TSP) monitoring was conducted for at least three times every 6 days, while impact 24-hour TSP monitoring was carried out for at least once every 6 days at the 4 monitoring stations (AMS2, AMS3A, AMS6 and AMS7).
3.1.2 The monitoring locations for impact air quality monitoring are depicted in Figure 2. However, for AMS6 (Dragonair/CNAC (Group) Building), permission on setting up and carrying out impact monitoring works was sought, however, access to the premise has not been granted yet on this report issuing date.
3.1.3 The weather was mostly sunny, with occasional cloudy and occasional rainy in the reporting quarter. The major dust source in the reporting quarter included construction activities from the Project, as well as nearby traffic emissions.
3.1.4 The number of monitoring events and exceedances recorded in each month of the reporting quarter are presented in Table 3.1 and Table 3.2 respectively.
Table 3.1 Summary of Number of Monitoring Events for 1-hr & 24-hr TSP Concentration
|
Monitoring Parameter |
Location |
No. of monitoring events |
||
|
March 13 |
April 13 |
May 13 |
||
|
1-hr TSP |
AMS2 |
15 |
18 |
15 |
|
AMS3A |
15 |
18 |
15 |
|
|
AMS7 |
15 |
18 |
15 |
|
|
24-hr TSP |
AMS2 |
5 |
6 |
5 |
|
AMS3A |
5 |
6 |
5 |
|
|
AMS7 |
5 |
6 |
5 |
|
Table 3.2 Summary of Number of Exceedances for 1-hr & 24-hr TSP Monitoring
|
Monitoring Parameter |
Location |
Level of Exceedance |
Level of Exceedance |
||
|
March 13 |
April 13 |
May 13 |
|||
|
1-hr TSP |
AMS2 |
Action |
0 |
0 |
0 |
|
Limit |
0 |
0 |
0 |
||
|
AMS3A |
Action |
0 |
0 |
0 |
|
|
Limit |
0 |
0 |
0 |
||
|
AMS7 |
Action |
0 |
0 |
0 |
|
|
Limit |
0 |
0 |
0 |
||
|
|
Total |
0 |
0 |
0 |
|
|
24-hr TSP |
AMS2 |
Action |
0 |
0 |
0 |
|
Limit |
0 |
0 |
0 |
||
|
AMS3A |
Action |
2 |
1 |
0 |
|
|
Limit |
1 |
1 |
0 |
||
|
AMS7 |
Action |
0 |
1 |
0 |
|
|
Limit |
0 |
0 |
0 |
||
|
|
Total |
3 |
3 |
0 |
|
3.1.5 All impact 1-hour TSP monitoring results at all monitoring locations were below the Action and Limit Levels in the reporting quarter.
3.1.6 One (1) 24-hour TSP results exceeded the Action Level at monitoring station AMS7, three (3) 24-hour TSP results exceeded the Action Level at monitoring station AMS3A and two (2) 24-hour TSP result exceeded the Limit Level at monitoring station AMS3A. The investigation results showed that the action and limit level exceedances were non-project related. All 1-hour TSP results were below the Action and Limit Level at all monitoring locations in the reporting month. Investigation results show that both the Action and Limit Level exceedance of 24-hour TSP results were not project-related.
3.1.7 For the one (1) 24-hour TSP result exceeded the Limit Level on 04 March 13 at monitoring station AMS3A, according to information provided by the Contractor, land-based construction activity such as transloading and delivery of geotextile and installing sand bags were undertaken at Works Area WA2 during the monitoring period which is unlikely to cause fugitive dust emission.
3.1.7.1 Functional checking on HVS at AMS3A was done. Air flow of the HVS was checked and the flow was steady during the 24-hr TSP sampling at AMS3A. The filter paper was re-weighted by the assigned HOKLAS laboratory and the result was reconfirmed.
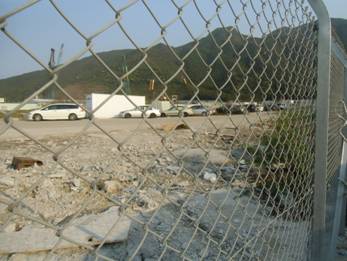
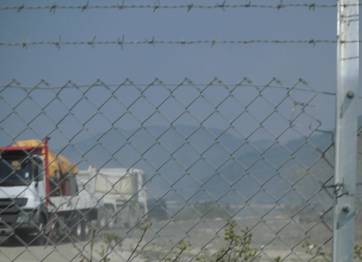
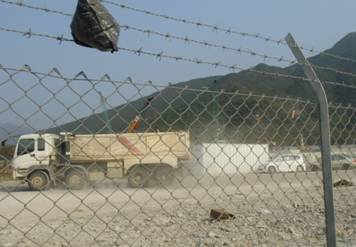
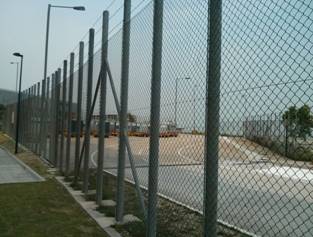
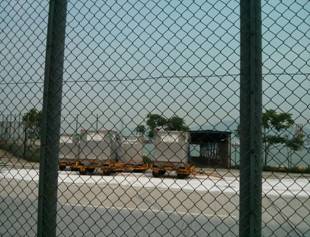
3.1.7.2 Construction activities, like sheet piling and percussive piling, were carrying out by nearby private development project during the course of monitoring, which are close to the monitoring station AMS3A but beyond the site boundary of Works Area WA2. Trucks were observed passing exposed soil surfaces at those construction sites of nearby private development project.
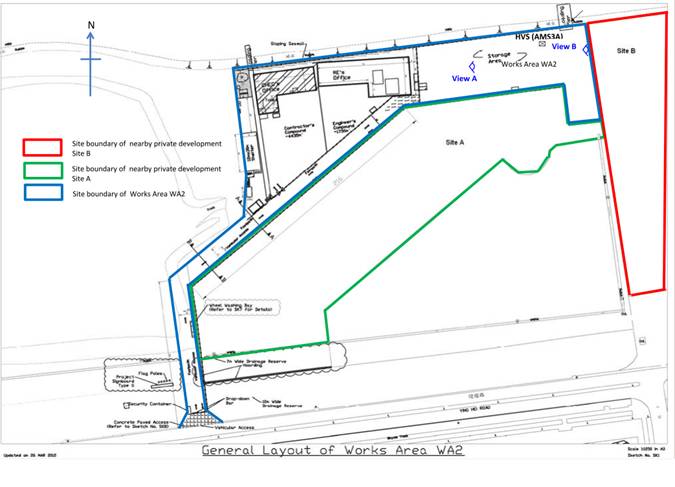
3.1.7.3 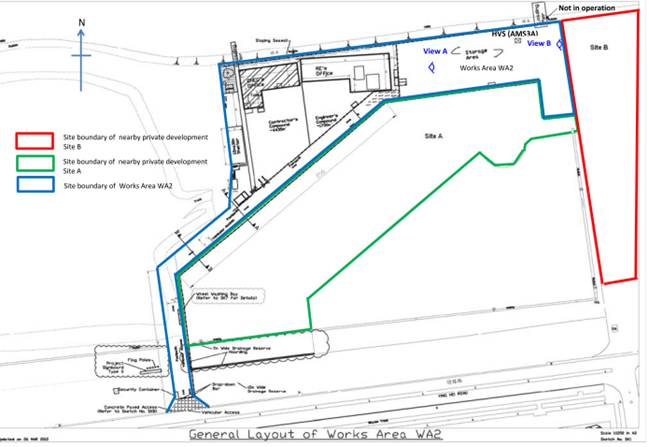 Please see layout map attached for reference of site conditions
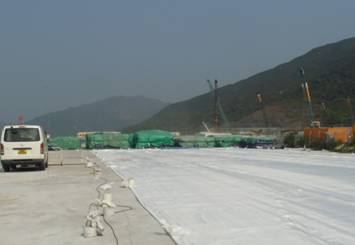
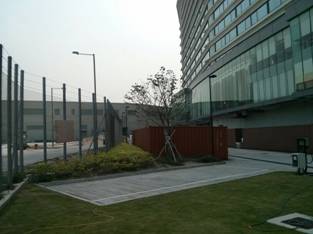
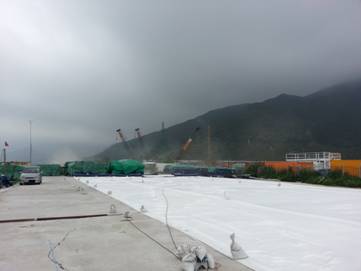
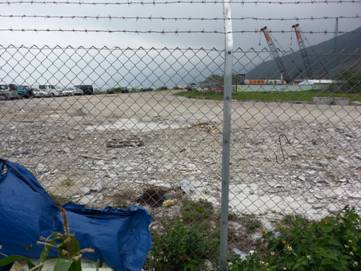
3.1.7.4 Please see photos attached for reference of site conditions:
View of Works Area WA2 : Hard paved ground next to monitoring station AMS3A (View A)
View on Site B: Beyond the site boundary of WA2 (View B)
3.1.7.5 As refer to the wind data collected at wind station at Works Area WA2 during the monitoring period on 4 and 5 March 13 (please see attached) south-southeast wind was prevailing during the monitoring period. Construction works carried out at construction sites of nearby private development project may contribute to the measured dust levels at the monitoring station AMS3A.
3.1.7.6 The 1-hr TSP values recorded at AMS3A on 4 March 2013, which are within the monitoring period of the 24-hr TSP, were 85 g/m3, 83 g/m3 and 84 g/m3 respectively. All measured values are well below the Action and Limit Levels.
3.1.7.7 The measured 24-hr TSP values recorded at AMS2 and AMS7 (which are closer to the marine-based works areas) on the same monitoring date were 99 g/m3 and 124 g/m3 respectively, which are below the Action and Limit Levels.
3.1.7.8 The following dust mitigation measures have been implemented at Works Area WA2:
l Works Area WA2��s surface was hard-paved, compacted or hydro-seeded
l Vehicle washing facility was provided at vehicle exit points,
l Measures for preventing fugitive dust emission are provided, e.g. tarpaulin covers.
3.1.7.9 The dust exceedance was therefore considered not to be due to the Project works.
3.1.7.10 The Contractor was recommended to continue implementing existing dust mitigation measures.
3.1.8 For the one (1) 24-hour TSP result exceeded the action Level on 09 March 13 at monitoring station AMS3A, according to information provided by the Contractor, land-based construction activity such as transloading and delivery of geotextile and installing sand bags to vessels was being undertaken at Works Area WA2 during the monitoring period.
3.1.8.1 Functional checking on HVS at AMS3A was done. Air flow of the HVS was checked and the flow was steady during the 24-hr TSP sampling at AMS3A. The filter paper was re-weighted by the assigned HOKLAS laboratory and the result was reconfirmed.
3.1.8.2 As informed by the Contractor, construction activities like sheet piling and percussive piling, were carrying out by nearby private development project during the course of monitoring, which are close to the monitoring station AMS3A but beyond the site boundary of Works Area WA2. Traffics were observed passing exposed soil surfaces at those construction sites of nearby private development project.
3.1.8.3  Please see layout map attached for reference of
site conditions
Please see layout map attached for reference of
site conditions
3.1.8.4 Please see photos attached for reference of site conditions:
View of Works Area WA2 : the hard paved ground next to monitoring station AMS3A (View A)
View on Site B: Beyond the site boundary of WA2 (View B)
3.1.8.5 As refer to the wind data collected at wind station at Works Area WA2 during the monitoring period on 8 and 9 March 13 (as attached) south wind was prevailing during the monitoring period. Construction works carried out at construction sites of nearby private development project may contribute to the measured dust levels at the monitoring station AMS3A.
3.1.8.6 The 1-hr TSP values recorded at AMS3A on 09 March 2013, which are within the monitoring period of the 24-hr TSP, were 96 g/m3, 97 g/m3 and 98 g/m3 respectively. All measured values are well below the Action and Limit Levels.
3.1.8.7 The measured 24-hr TSP values recorded at AMS2 and AMS7 (which are closer to the marine-based works areas) on the same monitoring date were 89 g/m3 and 124 g/m3 respectively, which are below the Action and Limit Levels.
3.1.8.8 The following dust mitigation measures have been implemented at Works Area WA2:
l Works Area WA2��s surface was hard-paved, compacted or hydro-seeded
l Vehicle washing facility was provided at vehicle exit points,
l Measures for preventing fugitive dust emission are provided, e.g. tarpaulin covers.
3.1.8.9 The dust exceedance was therefore considered not to be due to the Project works.
3.1.8.10 The Contractor was recommended to continue implementing existing dust mitigation measures.
3.1.9 For the one (1) 24-hour TSP result exceeded the Limit Level on 15 March 13 at monitoring station AMS3A, according to information provided by the Contractor, land-based construction activity such as using canvas to cover sand material and stitching geotextile were being undertaken at Works Area WA2 during the monitoring period.
3.1.9.1 Functional checking on HVS at AMS3A was done. Air flow of the HVS was checked and the flow was steady during the 24-hr TSP sampling at AMS3A. The filter paper was re-weighted by the assigned HOKLAS laboratory and the result was reconfirmed.
3.1.9.2 As informed by the Contractor, construction activities like sheet piling and percussive piling, were carrying out by nearby private development project during the course of monitoring, which are close to the monitoring station AMS3A but beyond the site boundary of Works Area WA2. Traffics were observed passing exposed soil surfaces at those construction sites of nearby private development project.
3.1.9.3 Please see layout map attached for reference of site conditions:

3.1.9.4
Please see photos attached for reference of site conditions:
View of Works Area WA2
: the hard paved ground next to monitoring station AMS3A (View A)
View on Site B: Beyond the site boundary of WA2 (View B)
3.1.9.5 As refer to the wind data collected at wind station at Works Area WA2 during the monitoring period on 14 and 15 March 13 (as attached) southeast winds was prevailing during the monitoring period. Construction works carried out at construction sites of nearby private development project may contribute to the measured dust levels at the monitoring station AMS3A.
3.1.9.6 The 1-hr TSP values recorded at AMS3A on 15 March 2013, which are within the monitoring period of the 24-hr TSP, were 85 g/m3, 85 g/m3 and 83 g/m3 respectively. All measured values are well below the Action and Limit Levels.
3.1.9.7 The measured 24-hr TSP values recorded at AMS2 and AMS7 (which are closer to the marine-based works areas) on the same monitoring date were 99 g/m3 and 127 g/m3 respectively, which are below the Action and Limit Levels.
3.1.9.8 The following dust mitigation measures have been implemented at Works Area WA2:
l Works Area WA2��s surface was hard-paved, compacted or hydro-seeded
l Vehicle washing facility was provided at vehicle exit points,
l Measures for preventing fugitive dust emission are provided, e.g. tarpaulin covers.
3.1.9.9 The dust exceedance was therefore considered not to be due to the Project works.
3.1.9.10 The Contractor was recommended to continue implementing existing dust mitigation measures.
3.1.10 For the one (1) 24-hour TSP result exceeded the Limit Level on 8 April 13 at monitoring station AMS3A, according to information provided by the Contractor, land-based construction activity such as using canvas to cover sand material and stitching geotextile were being undertaken at Works Area WA2 during the monitoring period.
3.1.10.1 Functional checking on HVS at AMS3A was done. Air flow of the HVS was checked and the flow was steady during the 24-hr TSP sampling at AMS3A. The filter paper was re-weighted by the assigned HOKLAS laboratory and the result was reconfirmed.
3.1.10.2 As informed by the Contractor, construction activities like sheet piling and percussive piling, were carrying out by nearby private development project during the course of monitoring, which are close to the monitoring station AMS3A but beyond the site boundary of Works Area WA2. Traffics were observed passing exposed soil surfaces at those construction sites of nearby private development project. Please also see photo and layout map attached for reference of site conditions.
3.1.10.3 As refer to the wind data collected at wind station at Works Area WA2 during the monitoring period on 08 and 09 April 13 (as attached) East winds was prevailing during the monitoring period. Construction works carried out at construction sites of nearby private development project may contribute to the measured dust levels at the monitoring station AMS3A.
3.1.10.4 The 1-hr TSP values recorded at AMS3A on 08 April 13, which are within the monitoring period of the 24-hr TSP, were 84 g/m3, 87 g/m3 and 81g/m3 respectively. All measured values are well below the Action and Limit Levels.
3.1.10.5 The measured 24-hr TSP values recorded at AMS2 and AMS7 (which are closer to the marine-based works areas) on the same monitoring date were 104 g/m3 and 127 g/m3 respectively, which are below the Action and Limit Levels.
3.1.10.6 The following dust mitigation measures have been implemented at Works Area WA2:
l Works Area WA2��s surface was hard-paved, compacted or hydro-seeded
l Vehicle washing facility was provided at vehicle exit points,
l Measures for preventing fugitive dust emission are provided, e.g. tarpaulin covers.
3.1.10.7
|
|
|
|
|
|
3.1.10.8 Please see photos attached for reference of site conditions:
View of Works Area WA2 : Hard paved ground next to monitoring station AMS3A (View A)
View on Site B: Beyond the site boundary of WA2 (View B)
3.1.10.9 The dust exceedance was therefore considered not to be due to the Project works.
3.1.10.10 The Contractor was recommended to continue implementing existing dust mitigation measures.
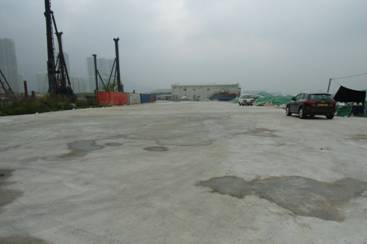
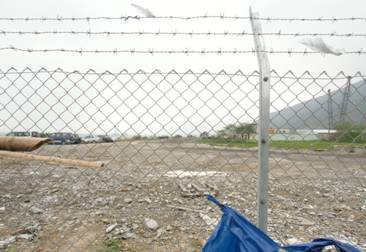
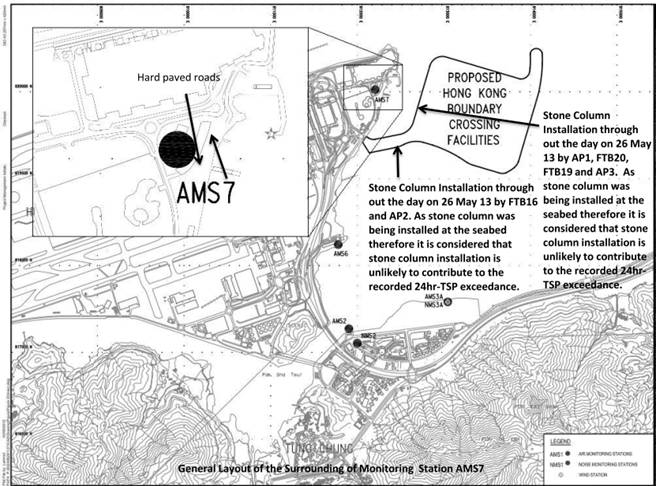
3.1.11 For the one (1) 24-hour TSP result exceeded the action Level on 13 April 13 at monitoring station AMS7, According to information provided by the Contractor, land-based construction activity such as delivering geotextile material was being undertaken at Works Area WA2 during the monitoring period. Marine-based construction activity such as stone column installation was being undertaken at portion D and portion A.
3.1.11.1 Stone column was being installed at the seabed therefore it is considered that stone column installation is unlikely to contribute to the recorded 24hr-TSP exceedance.
3.1.11.2 Functional checking on HVS at AMS7 was done. Air flow of the HVS was checked and the flow was steady during the 24-hr TSP sampling at AMS3A. The filter paper was re-weighted by the assigned HOKLAS laboratory and the result was reconfirmed.
3.1.11.3 The 1-hr TSP values recorded at AMS7 on 13 April 13, which are within the monitoring days of the 24-hr TSP, were 83 g/m3, 81 g/m3 and 80g/m3 respectively. All measured values are well below the Action and Limit Levels.
3.1.11.4 The measured 24-hr TSP values recorded at AMS2 and AMS3A on the same monitoring date were 64 g/m3 and 53 g/m3 respectively, which are below the Action and Limit Levels.
3.1.11.5 On the other hand, according to observation made at the monitoring station AMS7, there was no non-project potential cause/activity at the surrounding of monitoring station AMS7 which might potentially contribute to the dust action level exceedance.
3.1.11.6 As refer to the wind data collected at wind station at Works Area WA2 during the monitoring period on 13 and 14 April 13 (as attached) southwest winds was prevailing during the monitoring period. Construction works carried out by this Contract is unlikely to cause dust exceedance at AMS7 under southwest prevailing wind direction.
3.1.11.7 The following dust mitigation measures have been implemented at Works Area WA2:
l Works Area WA2��s surface was hard-paved, compacted or hydro-seeded
l Vehicle washing facility was provided at vehicle exit points,
l Measures for preventing fugitive dust emission are provided, e.g. tarpaulin covers.
3.1.11.8 The following dust mitigation measures have been implemented at throughout the construction site:
l Excavators and generators were operated by ultra low sulphur diesel (ULSD) to minimize the possibility of air pollution.
3.1.11.9 Please see layout map attached for reference of site conditions
3.1.11.10 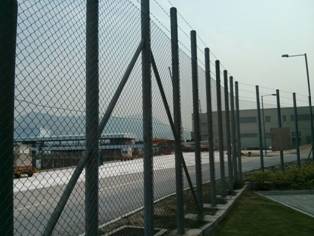 Please see photos of the conditions of the surrounding
near the monitoring station AMS7:
Please see photos of the conditions of the surrounding
near the monitoring station AMS7:
3.1.11.11 The dust exceedance was therefore considered not to be due to the Project works.
3.1.11.12 The Contractor was recommended to continue implementing existing dust mitigation measures.
3.1.12 For the one (1) 24-hour TSP result exceeded the Limit Level on 29 April 13 at monitoring station AMS3A, according to information provided by the Contractor, land-based construction activity such as using installation of sandbags and stitching geotextile were being undertaken at Works Area WA2 during the monitoring period.
3.1.12.1 Functional checking on HVS at AMS3A was done. Air flow of the HVS was checked and the flow was steady during the 24-hr TSP sampling at AMS3A. The filter paper was re-weighted by the assigned HOKLAS laboratory and the result was reconfirmed.
3.1.12.2 As informed by the Contractor, construction activities like sheet piling and percussive piling, were carrying out by nearby private development project during the course of monitoring, which are close to the monitoring station AMS3A but beyond the site boundary of Works Area WA2. Traffics were observed passing exposed soil surfaces at those construction sites of nearby private development project. Please also see photo and layout map attached for reference of site conditions.
3.1.12.3 As refer to the wind data collected at wind station at Works Area WA2 during the monitoring period on 29 and 30 April 13 (as attached) South-southeast winds was prevailing during the monitoring period. Construction works carried out at construction sites of nearby private development project may contribute to the measured dust levels at the monitoring station AMS3A.
3.1.12.4 The 1-hr TSP values recorded at AMS3A on 29 April 13, which are within the monitoring period of the 24-hr TSP, were 82 g/m3, 82 g/m3 and 79g/m3 respectively. All measured values are well below the Action and Limit Levels.
3.1.12.5 The measured 24-hr TSP values recorded at AMS2 and AMS7 (which are closer to the marine-based works areas) on the same monitoring date were 38 g/m3 and 54 g/m3 respectively, which are below the Action and Limit Levels.
3.1.12.6 The following dust mitigation measures have been implemented at Works Area WA2:
�P Works Area WA2��s surface was hard-paved, compacted or hydro-seeded
�P Vehicle washing facility was provided at vehicle exit points,
�P Measures for preventing fugitive dust emission are provided, e.g. tarpaulin covers.
3.1.12.7 Conditions of the construction sites near Works Area WA2:
3.1.12.8 Please see layout map attached for reference of site conditions
3.1.12.9 Please see photos attached for reference of site conditions:
View of Works Area WA2 : the hard paved ground next to monitoring station AMS3A (View A)
 Vew on Site B: Beyond the site boundary of WA2 (View B)
|
|
3.1.12.10 The dust exceedance was therefore considered not to be due to the Project works.
3.1.12.11 The Contractor was recommended to continue implementing existing dust mitigation measures.
3.2 Noise Monitoring
3.2.1 Impact noise monitoring was conducted at the 2 monitoring stations (NMS2 and NMS3A) for at least once per week during 07:00 �V 19:00 in the reporting quarter.
3.2.2 The monitoring locations used during the reporting quarter are depicted in Figure 2.
3.2.3 Due to one documented complaint is received; one (1) Action Level Exceedance of construction noise was recorded in the reporting quarter. The investigation results showed that the action level exceedance was non-project related. No Limit Level Exceedance of construction noise was recorded in the reporting quarter.
3.2.4 Major noise sources during the noise monitoring included construction activities of the Project and nearby traffic noise.
3.2.5 The number of impact noise monitoring events and exceedances are summarized in Table 3.3 and Table 3.4 respectively
Table 3.3 Summary of Number of Monitoring Events for Impact Noise
|
Monitoring Parameter |
Location |
No. of monitoring events |
||
|
March 12 |
April 13 |
May 13 |
||
|
NMS2 |
4 |
4 |
4 |
|
|
NMS3A |
4 |
4 |
4 |
|
Table 3.4 Summary of Number of Monitoring Exceedances for Impact Noise
|
Monitoring Parameter |
Location |
Level of Exceedance |
Level of Exceedance |
||
|
March 12 |
April 13 |
May 13 |
|||
|
NMS2 |
Action |
0 |
0 |
0 |
|
|
Limit |
0 |
0 |
0 |
||
|
NMS3A |
Action |
0 |
0 |
0 |
|
|
Limit |
0 |
0 |
0 |
||
|
|
Total |
0 |
0 |
0 |
|
3.2.6 The graphical plots of the trends of the monitoring results are provided in Appendix F. No specific trend of the monitoring results or existence of persistent pollution source was noted.
3.3 Water Quality Monitoring
3.3.1 Impact water quality monitoring was conducted 3 times per week during mid-ebb and mid-flood tides at 21 water monitoring stations (9 Impact Stations, 7 Sensitive Receiver Stations and 5 Control/Far Field Stations).
3.3.2 The monitoring locations used during the reporting quarter are depicted in Figure 3.
3.3.3 Ten (10) Action Level exceedances were recorded at measured suspended solids (SS) values (in mg/L) in the reporting quarter, one (1) Limit Level exceedance was recorded at measured suspended solids (SS) values (in mg/L) in the reporting quarter and 1 Action Level exceedance was recorded at turbidity (NTU) in the reporting quarter. Investigation result show that the exceedances were not due to the Project works.
Table 3.5 Summary of Water Quality Exceedances in March-May 2013
|
Exceedance Level |
DO (S&M) |
DO (Bottom) |
Turbidity |
SS |
Total |
||||||
|
Ebb |
Flood |
Ebb |
Flood |
Ebb |
Flood |
Ebb |
Flood |
Ebb |
Flood |
||
|
Action |
0 |
0 |
0 |
0 |
0 |
0 |
0 |
0 |
0 |
0 |
|
|
Limit |
0 |
0 |
0 |
0 |
0 |
0 |
0 |
0 |
0 |
0 |
|
|
IS(Mf)6 |
Action |
0 |
0 |
0 |
0 |
0 |
0 |
0 |
1 (8 May 13) |
0 |
1 |
|
Limit |
0 |
0 |
0 |
0 |
0 |
0 |
0 |
0 |
0 |
0 |
|
|
IS7 |
Action |
0 |
0 |
0 |
0 |
0 |
0 |
0 |
1 (8 May 13) |
0 |
1 |
|
Limit |
0 |
0 |
0 |
0 |
0 |
0 |
0 |
0 |
0 |
0 |
|
|
IS8 |
Action |
0 |
0 |
0 |
0 |
0 |
0 |
0 |
2 (10 Apr & 8 May, 13) |
0 |
2 |
|
Limit |
0 |
0 |
0 |
0 |
0 |
0 |
0 |
0 |
0 |
0 |
|
|
IS(Mf)9 |
Action |
0 |
0 |
0 |
0 |
0 |
0 |
1 (8 May 13) |
1 (8 May 13) |
1 |
1 |
|
Limit |
0 |
0 |
0 |
0 |
0 |
0 |
0 |
0 |
0 |
0 |
|
|
IS10 |
Action |
0 |
0 |
0 |
0 |
0 |
0 |
0 |
0 |
0 |
0 |
|
Limit |
0 |
0 |
0 |
0 |
0 |
0 |
0 |
0 |
0 |
0 |
|
|
IS(Mf)11 |
Action |
0 |
0 |
0 |
0 |
0 |
0 |
0 |
0 |
0 |
0 |
|
Limit |
0 |
0 |
0 |
0 |
0 |
0 |
0 |
0 |
0 |
0 |
|
|
IS(Mf)16 |
Action |
0 |
0 |
0 |
0 |
0 |
0 |
1 (29 Mar 13) |
1 (22 Apr 13) |
1 |
1 |
|
Limit |
0 |
0 |
0 |
0 |
0 |
0 |
0 |
0 |
0 |
0 |
|
|
IS17 |
Action |
0 |
0 |
0 |
0 |
0 |
1 (29 Apr 13) |
0 |
0 |
0 |
1 |
|
Limit |
0 |
0 |
0 |
0 |
0 |
0 |
0 |
0 |
0 |
0 |
|
|
SR3 |
Action |
0 |
0 |
0 |
0 |
0 |
0 |
0 |
0 |
0 |
0 |
|
Limit |
0 |
0 |
0 |
0 |
0 |
0 |
0 |
0 |
0 |
0 |
|
|
SR4(N) |
Action |
0 |
0 |
0 |
0 |
0 |
0 |
0 |
1 (10 Apr 13) |
0 |
1 |
|
Limit |
0 |
0 |
0 |
0 |
0 |
0 |
0 |
0 |
0 |
0 |
|
|
SR5 |
Action |
0 |
0 |
0 |
0 |
0 |
0 |
0 |
1 (26 April, 13 |
0 |
1 |
|
Limit |
0 |
0 |
0 |
0 |
0 |
0 |
0 |
1 (29 Mar 13) |
0 |
1 |
|
|
SR6 |
Action |
0 |
0 |
0 |
0 |
0 |
0 |
0 |
0 |
0 |
0 |
|
Limit |
0 |
0 |
0 |
0 |
0 |
0 |
0 |
0 |
0 |
0 |
|
|
SR7 |
Action |
0 |
0 |
0 |
0 |
0 |
0 |
0 |
0 |
0 |
0 |
|
Limit |
0 |
0 |
0 |
0 |
0 |
0 |
0 |
0 |
0 |
0 |
|
|
SR10A |
Action |
0 |
0 |
0 |
0 |
0 |
0 |
0 |
0 |
0 |
0 |
|
Limit |
0 |
0 |
0 |
0 |
0 |
0 |
0 |
0 |
0 |
0 |
|
|
SR10B (N) |
Action |
0 |
0 |
0 |
0 |
0 |
0 |
0 |
0 |
0 |
0 |
|
Limit |
0 |
0 |
0 |
0 |
0 |
0 |
0 |
0 |
0 |
0 |
|
|
Total |
Action |
0 |
0 |
0 |
0 |
0 |
0 |
0 |
0 |
11 (29 Mar 2013; 10, 22 26 & 29 Apr 2013; 8 May 2013) |
|
|
|
Limit |
0 |
0 |
0 |
0 |
0 |
0 |
0 |
0 |
1(29 Mar 13) |
|
Note: S: Surface;
M: Mid-depth;
3.3.4 One (1) Limit and Action (1) Limit Level exceedance were recorded at during mid flood tide at SR5 and mid ebb tide at IS(Mf)16 respectively on 29 Mar 13. The investigation results show that the action and limit level exceedance were non-project related.
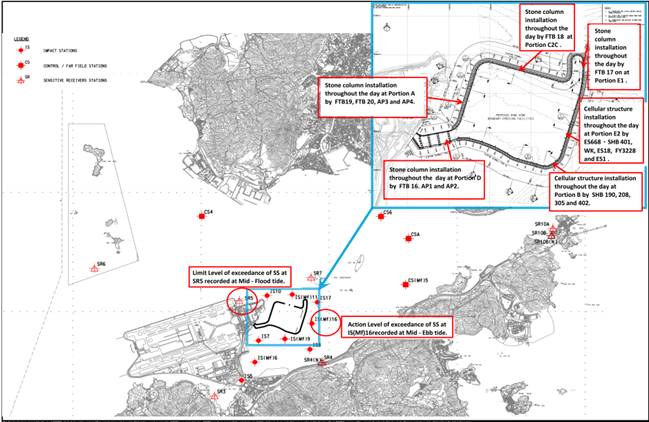
3.3.4.1 As informed by the Contractor, stone column installation was carried out throughout the day at Portion D by FTB 16, AP1 and AP2; at Portion A by FTB19, FTB 20, AP3 and AP4; at Portion C2c by FTB 18 and at Portion E1 by FTB 17. Cellular structure installation works was conducted at Portion E2 by ES668�BSHB 401, WK, ES18, FY3228 and ES1 and at Portion B by SHB190, 208, 305 and 402..
3.3.4.2 Exceedances were not due to marine based construction works of the Project because:
3.3.4.3 For exceedance recorded at SR5 during mid flood tide, since monitoring stations IS10 and IS(Mf)11 are considered downstream and closer to the active works than monitoring station SR5 and the Suspended Solids values recorded at IS10 and IS(Mf)11 are all below the Action and Limit Level during same tide on the same day. The water quality noted at downstream of and closer to active works were not adversely affected by active works.Hence it is considered that the exceedance recorded at SR5 are not related to the Project.
3.3.4.4 For action level exceedance of suspended solid recorded at IS(Mf)16 during mid ebb tide, stone column installations were carried out at almost the same locations on 27, 29 Mar 13 and 1 April 13, but all Suspended Solids results recorded at all monitoring location on 27 Mar 13 and 1 Apr 13 are all below the Action and Limit Level. Which indicates that stone column installation is unlikely to contribute to the action level exceedance recorded at IS(Mf)16.
3.3.4.5 When impact water quality monitoring was carried out during mid ebb and mid flood tide at monitoring location IS(Mf)16 on 29 Mar 13, yellow brown color of sea water was noted but no silty plume was observed to flow from the inside to the outside of the site boundary.
3.3.4.6 Cellular structure installation work was conducted at Portion E2 by ES668�BSHB 401, WK, ES18, FY3228 and ES1 and at Portion B by SHB190, 208, 305 and 402 during mid ebb tide on 29 Mar 13 but cellular structure installation was considered unlikely to contribute to elevation of suspended solid.
3.3.4.7 The exceedances were likely due to local effects in the vicinity of SR5 and IS(Mf)16.
3.3.4.8 Floating type silt curtains were provided around the whole works area. In addition, it was noted that the Contractor swiftly rectified the perimeter silt curtain in particular the portions which defects were observed on 28 March 13 to ensure the sediment plume generated by construction activities could be prevented from discharging to areas outside the site boundary.
3.3.4.9 The Contractor was reminded to carry out maintenance work once defects were found.
3.3.4.10 As informed by the Contractor, maintenance work of the silt curtain was carried out on a daily basis except Sunday and public holiday.
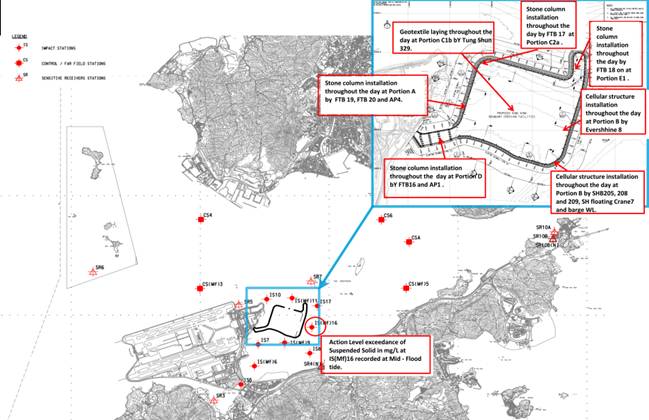
3.3.5 One (1) Action Level exceedance of turbidity (NTU) was recorded at during mid flood tide at IS17 on 29 April 13. Four (4) Action Level exceedances of SS were recorded during the reporting period. Where two (2) Action Level exceedance were recorded at during mid flood tide at IS8 and SR4(N) respectively on 10 April 13, one (1) were recorded at during mid flood tide at IS(Mf)16 on 22 April 13; one (1) was recorded during mid flood tide at SR5 on 26 April 13.
3.3.5.1 For the two (2) Action Level exceedance were recorded at during mid flood tide at IS8 and SR4(N) respectively on 10 April 13. The investigation results show that the action exceedances were non-project related.
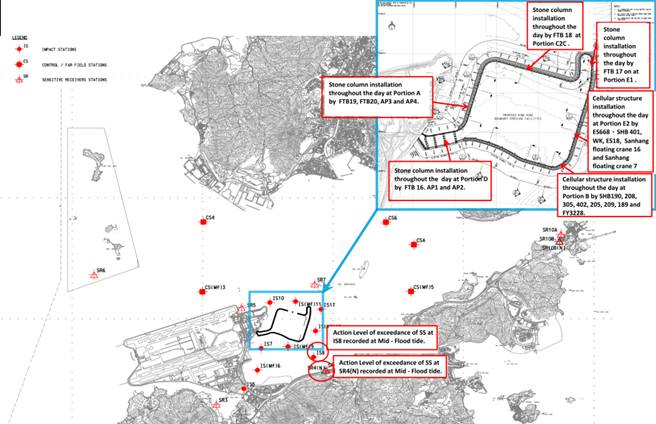
3.3.5.2 As informed by the Contractor, stone column installation was carried out throughout the day at Portion D by FTB 16, AP1 and AP2; at Portion A by FTB 19, FTB 20, AP3 and AP4; at Portion C2c by FTB 18 and at Portion E1 by FTB 17. Cellular structure installation works were conducted at Portion E2 by ES668�BSHB 401, WK, ES18, Sanhang floating crane 16 and Sanhang floating crane 7 and at Portion B by SHB190, 208, 305, 402, 205, 209, 189 and FY3228.
3.3.5.3 Exceedances were not due to marine based construction works of the Project because:
3.3.5.4 IS(Mf)9 and IS(Mf)16 are located closer to the active works than monitoring station IS8 and SR4(N). Depth Averrage Suspended Solids (SS) values (in mg/L) recorded during the flood tide on the same day at IS(Mf)9 and IS(Mf)16 were below the Action and Limit Level.
3.3.5.5 The monitoring location of monitoring station IS8 and SR4(N) are considered upstream to the active works of this project. Therefore it was unlikely that the exceedances recorded at IS8 and SR4(N) were due to active construction activities of this project.
3.3.5.6 Cellular structure installation works were conducted at Portion E2 and at Portion B by construction vessels during mid flood tide on 10 Apr 13 but cellular structure installation was considered unlikely to contribute to elevation of Suspended Solids.
3.3.5.7 The exceedances were likely due to local effects in the vicinity of IS8 and SR4(N).
3.3.5.8 Nevertheless, the Contractor was reminded to ensure provision of ongoing maintenance to the silt curtains.
3.3.5.9 Maintenance work of the silt curtain was carried out by the Contractor on a daily basis except Sunday and public holiday.
3.3.5.10 The investigation results show that the action and limit level exceedance were non-project related.
3.3.6 For the one (1) Action Level exceedance were recorded at during mid flood tide at IS17 on 29 April 13. The investigation results show that the action exceedances were non-project related.
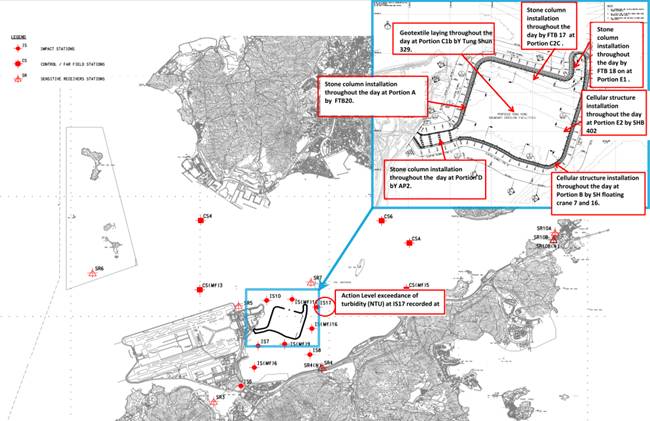
3.3.6.1 Stone column installation was carried out throughout the day at Portion D by AP2 and AP4; at Portion A by FTB 20; at Portion C2c by FTB 17 and at Portion E1 by FTB 18. Cellular structure installation works was conducted at Portion E2 by SHB 402; at Portion B by SH Floating Crane 7 and 16; Geotextile laying at Portion C1b by Tung Shun 329.
3.3.6.2 For action level exceedance of depth averaged turbidity (in NTU) recorded at IS17 during mid ebb tide, stone column installations were carried out at almost the same locations on 26, 29 Apr 13 and 1 May 13, but all depth averaged turbidity (in NTU) results recorded at all monitoring location on 26 Apr 13 and 1 May 13 were all below the Action and Limit Level. Which indicates that stone column installation is unlikely to contribute to the action level exceedance recorded at IS17?
3.3.6.3 When impact water quality monitoring was carried out during mid ebb at monitoring location IS17 on 29 April 13, no discoloration of sea water was observed and no silty plume were observed to flow from the inside to the outside of the site boundary.
3.3.6.4 Cellular structure installation works was conducted at Portion E2 by SHB 402; at Portion B by SH Floating Crane 7 and 16 but cellular structure installation was considered unlikely to contribute to elevation of depth averaged turbidity (in NTU).
3.3.6.5 The exceedances were likely due to local effects in the vicinity of IS17.
3.3.6.6 Nevertheless, the Contractor was reminded to ensure provision of ongoing maintenance to the silt curtains.
3.3.6.7 Maintenance work of the silt curtain was carried out by the Contractor on a daily basis except Sunday and public holiday.
3.3.7 For the one (1) Action Level exceedance were recorded at during mid flood tide at IS(Mf)16 on 22 April 13. Stone column installation was carried out throughout the day at Portion D by AP1 and FTB16; at Portion A by FTB 19, 20 and AP4; at Portion C2a by FTB 17 and geotextile laying was carried out throughout the day by Tung Shun 329 at Portion C2a, at Portion E1 by FTB 18. Cellular structure installation works was conducted at Portion B by SHB402, SHB205, SHB208 and SHB209.
3.3.7.1 Exceedances were not due to marine based construction works of the Project because:
3.3.7.2 For action level exceedance of depth averaged SS (in mg/L) recorded at IS(Mf)16 during mid flood tide, stone column installations were carried out at almost the same locations on 19, 22 and 24 Apr 13, but all depth averaged SS (in mg/L) results recorded at all monitoring location on 19 and 24 Apr 13 13 were all below the Action and Limit Level. Which indicates that stone column installation is unlikely to contribute to the action level exceedance recorded at IS(Mf)16.
3.3.7.3 When impact water quality monitoring was carried out during mid flood tide at monitoring location IS(Mf)16 on 22 April 13, no discoloration of sea water was observed and no silty plume were observed to flow from the inside to the outside of the site boundary.
3.3.7.4 Cellular structure installation works was conducted at Portion B by SHB402, SHB205, SHB208 and SHB209 but cellular structure installation was considered unlikely to contribute to elevation of depth averaged SS (in mg/L).
3.3.7.5 Location of monitoring station IS(Mf)16 is considered upstream to active works during mid flood tide and therefore it is unlikely that the elevation of suspended solid is caused by active works.
3.3.7.6 The exceedances were likely due to local effects in the vicinity of IS(Mf)16.
3.3.7.7 Nevertheless, the Contractor was reminded to ensure provision of ongoing maintenance to the silt curtains. The Contractor was reminded to carry out maintenance work once defects were found.
3.3.7.8 Maintenance work of the silt curtain was carried out by the Contractor on a daily basis except Sunday and public holiday.
3.3.8 For the one (1) Action Level exceedance were recorded at during mid flood tide at SR5 on 26 April 13. Stone column installation was carried out throughout the day at Portion A by AP2 and FTB 20; at Portion B by AP4; at Portion C2c by FTB 17 and at Portion E1 by FTB 18. Cellular structure installation works was conducted at Portion B by SHB 402, Evershine 8 and 668, SHB 205, 208, 209 and 305, SH Floating Crane 7 and FY3228; Geotextile laying at Portion C1b by Tung Shun 329.
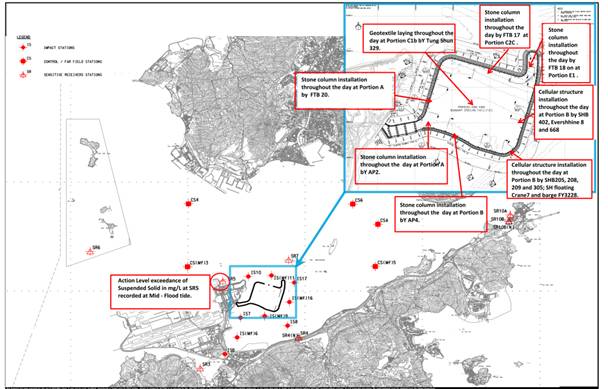
3.3.8.1 Exceedance was not due to marine based construction works of the Project because:
3.3.8.2 Impact Stations IS10 and IS(Mf)11 which are considered downstream and closer to the works than Impact Station SR5. Since the Suspended Solids values recorded at IS10 and IS(Mf)11 are all below the Action and Limit Level during same tide on the same day. The water quality noted at downstream of and closer to active works were not adversely affected by active works.Hence it is considered that the exceedance recorded at SR5 are not related to the Project.
3.3.8.3 Same type of works was carried out at almost the same location on 24 April13 and 29 April13 but Suspended Solids values recorded at SR5 on 24 April13 and 29 April13 are all below the Action and Limit Level during the same tide on the same day.
3.3.8.4 The exceedance was likely due to local effects in the vicinity of SR5.
3.3.8.5 Nevertheless, the Contractor was reminded to ensure provision of ongoing maintenance to the silt curtains.
3.3.8.6 The Contractor was reminded to carry out maintenance work once defects were found.
3.3.8.7 Maintenance work of the silt curtain was carried out by the Contractor on a daily basis except Sunday and public holiday.
3.3.9 Five (5) Action Level Exceedances of SS at IS(Mf)6, IS(Mf)9, IS7 and IS8 at Mid-Flood tide and IS(Mf)9 at Mid-Ebb tide were recorded on 8 May 2013.
3.3.9.1 The investigation results show that the action exceedances were non-project related.
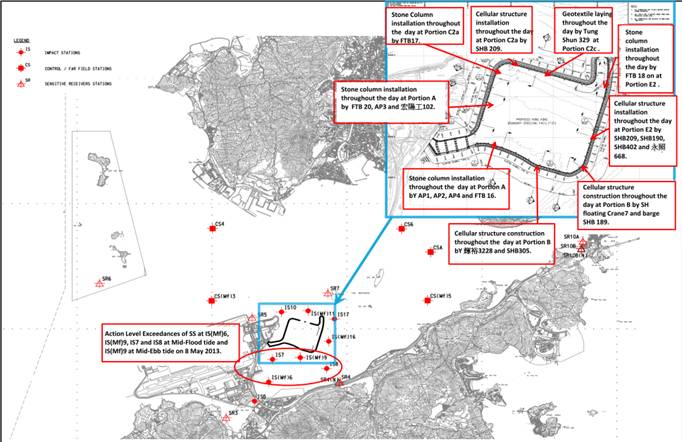
3.3.9.2 For type, location and duration of works carried out on 8 May 2013, please refer to the above layout map.
3.3.9.3 Exceedances were not due to marine based construction works of the Project because:
3.3.9.4 Same work at same portion was carried out on 6 and 10 May 13 while no exceedance was recorded on these two days at the same tide.
3.3.9.5 The water depth of IS(Mf)9 was 3.3m and 3.4m during mid ebb tide and mid flood tide respectively. The water depth of IS(Mf)6, IS7 and IS8 were 3.3m, 3.4m and 3.6m respectively during mid flood tide.
3.3.9.6 Strong wind and rough sea condition were experienced during the monitoring period, which is likely to affect the ambient water quality in such shallow water condition.
3.3.9.7 When impact water quality monitoring was carried out at IS(Mf)6, IS(Mf)9, IS7 and IS8 at Mid-Flood tide and IS(Mf)9 at Mid-Ebb tide on 8 May 2013, no silty plume was observed to flow from the inside to the outside of the site boundary.
3.3.9.8 No exceedance was recorded at IS(Mf)16 and IS17 which are considered downstream of active works during ebb tide and no exceedance was recorded at IS10 and IS(Mf)11 which are considered downstream of active works during flood tide.
3.3.9.9 The exceedances recorded were likely due to local effects in the vicinity at IS(Mf)6, IS(Mf)9, IS7 and IS8.
3.3.9.10 The exceedances were considered as Non-Project Related.
3.3.9.11 Nevertheless, the Contractor was reminded to ensure provision of ongoing maintenance to the silt curtains.
3.3.9.12 The Contractor was reminded to carry out maintenance work once defects were found.
3.3.9.13 Maintenance work of the silt curtain was carried out by the Contractor on a daily basis except Sunday and public holiday.
3.3.10 The graphical plots of the trends of the monitoring results are provided in Appendix G. No specific trend of the monitoring results or existence of persistent pollution source was noted.
3.4 Dolphin Monitoring
3.4.1 In accordance with the Project Specific EM&A Manual, pre-set and fixed transect line vessel based dolphin survey was required in two AFCD designated areas (Northeast Lantau (NEL) and Northwest Lantau (NWL) survey areas). The impact dolphin monitoring at each survey area should be conducted twice per month.
3.4.2 The impact dolphin monitoring conducted is vessel-based and combines line-transect and photo-ID methodology, which have adopted similar survey methodologies as that adopted during baseline monitoring to facilitate comparisons between datasets.
3.4.3 The layout map of impact dolphin monitoring have been provided by AFCD and is shown in Figure 4.
3.4.4 The effort summary and sighting details during the reporting quarter are shown in the Appendix H. A summary of key findings of the dolphin surveys completed during the reporting quarter is shown below:
Table 3.6 Summary of Key Dolphin Survey Findings in Mar 2013- May 2013
|
Number of Impact Surveys Completed^ |
6 |
|
Survey Distance Travelled under Favourable On- Effort Condition |
668.6km |
|
Number of Sightings |
22 sightings (13 sightings are ��on effort�� (which are all under favourable condition), 9 ��sightings are opportunistic��) |
|
Number of dolphin individual sighted |
72 individuals (the best estimated group size) |
|
Dolphin Encounter Rate# |
NEL: 0.0 NWL:3.1 |
|
Dolphin Group Size |
Average of 3.3 Varied from 1-12 individuals |
|
Most Often frequent dolphin sighting area |
Sha Chau and Lung Kwu Chau Marine Park area |
Remarks:
^ Completion of line transect survey of NEL and NWL survey area once was
counted as one complete survey.
# Dolphin Encounter Rate = (Sum of 1st 2nd, 3rd month��s total sighting/ Sum of 1st 2nd, 3rd month��s total effort)*100km (encounter rates are calculated using on effort sightings made under favourable conditions only.)
3.4.5 One (1) Limit level exceedance was recorded in the reporting quarter. The investigation results showed that there is no evidence that exceedances are related to Project works are annexed in Appendix L. Actions were taken according to the Event and Action Plan for impact dolphin monitoring. Please refer to Appendix L for details of action taken. Below table
|
Table 3.7 Summary of STG and ANI encounter rates in Mar 2013- May 2013 |
||||
|
|
NEL |
NWL |
Level Exceeded |
|
|
STG* |
0.00 |
3.00 |
Limit Level |
|
|
ANI** |
0.00 |
8.60 |
|
|
*Quarterly Average Encounter Rate of Number of Dolphin Sightings (STG) presents averaged encounter rates of the three monitored months in terms of groups per 100km per survey event.
STG Encounter rate = (Average of (total number sighting/total effort) of 1st and 2nd completed survey# of 1st month+ Average of (total number sighting/total effort) of 1st and 2nd completed survey# of 2nd month + Average of (total number sighting/total effort) of 1st and 2nd completed survey# of 3rd month)/3*100km
**Quarterly Average Encounter Rate of Total Number of Dolphins (ANI) presents averaged encounter rates of the three monitored months in terms of individuals per 100km per survey event.
ANI Encounter rate = (Average of (total number of Individual/total effort) of 1st and 2nd completed survey# of 1st month+ Average of (total number of Individual/total effort) of 1st and 2nd completed survey# of 2nd month + Average of (total number of Individual/total effort) of 1st and 2nd completed survey# of 3rd month +)/3*100km
3.4.6 Details of the comparison and analysis methodology and their findings and discussions are annexed in Appendix H.
3.4.7 It is noted that preparation works for other, non HKBCF Project started in January 2013 and have continued throughout March-May 2013. As such, there is increased boat traffic and underwater works in the southern sector of NWL.
3.5 Environmental Site Inspection and Audit
3.5.1 Site Inspections were carried out on a weekly basis to monitor the implementation of proper environmental pollution control and mitigation measures for the Project. In the reporting quarter, 13 site inspections were carried out. Recommendations on remedial actions were given to the Contractors for the deficiencies identified during the site audits.
3.5.2 Particular observations during the site inspections are described below:
Air Quality
3.5.3 No adverse observation was identified in the in the reporting Quarter.
Noise
3.5.4 An idle air compressor was found without a valid noise emission label on FTB19 and barge Sun Moon Kee. The Contractor was reminded to stick a valid noise emission label onto the compressor prior to operation of the compressor. (Reminder)
Water Quality
3.5.5 Defects at parts of the perimeter silt curtain at portions E1, C2a and C2c were rectified. The Contractor was reminded to keep monitor and well maintain of the silt curtain more frequently to ensure the silt curtain are fully functional. (Closed)
3.5.6 One of the existing bunding was found too low on barge FTB 17 and FTB19. The Contractor was reminded to enhance the height of the existing bunding to effectively contain potential oil leakage. The Contractor enhanced the height of the existing bunding to effectively contain potential oil leakage. (Closed)
3.5.7 The screw at the outlet of a drip tray on barge AP4, FTB20, Fai Yu 3228, SHB 208 and SHB402 was observed missing. The Contractor provided effective mitigation measures to effectively seal the outlet of the drip tray to prevent potential oil seepage in April 2013. The Contractor was advised to provide effective mitigation measures to effectively seal the outlet of the all drip tray to prevent potential oil seepage. (Closed)
3.5.8 Generator was observed without bunding or drip tray on Sanhang Floating Crane 7. The Contractor was reminded to provided mitigation measures such as bunding or drip tray to generator. The Contractor rectified the situation and provided bunding to generator. (Closed)
3.5.9 The silt curtain enclosing the stone column installation works was observed removed and as informed by the Contractor, this is due to maintenance of the stone column installation facility. The Contractor was reminded to install a layer of silt curtain near the active stone column installation points. (Reminder)
Chemical and Waste Management
3.5.10 Oil drums were found improperly stored on barge SHB 209, Fai Yui 3228, FTB19 and SHB 205, Sun Moon Kee. The Contractor immediately provided mitigation measures and put the oil drum inside bunding or remove the oil drum. The Contractor was reminded to provide mitigation measures such as drip tray or bunding to all oil drums. (Reminder)
3.5.11 Vibratory clamps were found improperly stored on barge SHB305. The Contractor should provide proper measures, like drip trays and tarpaulin sheet coverage, to retain any leaked oil from the plants. Vibratory clamps found improperly stored on barge SHB305 were removed in the reporting month. (Closed)
3.5.12 Oil drums were found without proper labels on barge FTB 18, FTB 19 and FTB17. The Contractor provided mitigation measures and labeled the oil drums. The Contractor was reminded to provide mitigation measures such as labeling to all oil drums. The Contractor provided mitigation measures such as labeling to all oil drums. (Closed)
3.5.13 General waste was observed uncovered on barge Fai Yui 3228 and SHB305. The Contractor rectified the condition upon notification by providing bin bags to waste and relocated them to a waste collection point. The Contractor was reminded to keep the barge surface clean and tidy. (Reminder)
3.5.14 Oil stains were observed on the barge surface of barge SHB 208 and FTB 20. The Contractor was reminded to clear the oil stain using absorbent material and dispose of as chemical waste. The Contractor was cleared the oil stain using absorbent material and dispose of as chemical waste. (Closed)
3.5.15 Oil was observed within the mechanical parts of a machine on FTB18. The Contractor was reminded to prevent oil being transferred from inside the drip tray to the barge surface. (Reminder)
3.5.16 A battery and chemical container was observed placed on barge FTB20 without drip tray. The Contractor was relocated that battery and chemical container inside the drip tray immediately. (Closed)
Landscape and Visual Impact
3.5.17 No adverse observation was identified in the reporting quarter.
Others
3.5.18 No adverse observation was identified in the reporting quarter.
3.5.19 The Contractor has rectified most of the observations as identified during environmental site inspection in the reporting quarter. Rectifications of remaining identified items are undergoing by the Contractor. Follow-up inspections on the status on provision of mitigation measures will be conducted to ensure all identified items are mitigated properly.
4
Advice on the Solid and Liquid Waste Management Status
4.1 Summary of Solid and Liquid Waste Management
4.1.1 The Contractor registered as a chemical waste producer for this project. Sufficient numbers of receptacles were available for general refuse collection and sorting.
4.1.2 As advised by the Contractor, 679,270.6 m3 of imported fill were imported for the Project use in the reporting quarter. 3200.0 L of chemical waste were generated and disposed of in the reporting quarter. 16.9 tonnes of general refuse were generated and disposed of in the reporting quarter. Summary of waste flow table is detailed in Appendix I.
4.1.3 The Contractor is advised to properly maintain on site C&D materials and wastes collection, sorting and recording system, dispose of C&D materials and wastes at designated ground and maximize reuse / recycle of C&D materials and wastes. The Contractor is reminded to properly maintain the site tidiness and dispose of the wastes accumulated on site regularly and properly.
4.1.4 The Contractor is reminded that chemical waste containers should be properly treated and stored temporarily in designated chemical waste storage area on site in accordance with the Code of Practice on the Packaging, Labelling and Storage of Chemical Wastes.
5
Implementation
Status of Environmental Mitigation Measures
5.1 Implementation Status of Environmental Mitigation Measures
5.1.1 In response to the site audit findings, the Contractors carried out corrective actions.
5.1.2 A summary of the Implementation Schedule of Environmental Mitigation Measures (EMIS) is presented in Appendix C. Most of the recommended mitigation measures. Moreover, regular review and checking on the construction methodologies, working processes and plants were carried out to ensure the environmental impacts were kept minimal and recommended environmental mitigation measures were implemented effectively.
5.1.3 Training of marine travel route for marine vessels operator was given to relevant staff and relevant records were kept properly.
5.1.4 Regarding the implementation of dolphin monitoring and protection measures (i.e. implementation of Dolphin Watching Plan, Dolphin Exclusion Zone and Silt Curtain integrity Check), regular checking were conducted by the experienced MMOs within the works area to ensure no dolphin was trapped by the enclosed silt curtain systems. Any dolphin spotted within the enclosed silt curtain systems was reported and recorded. Relevant procedures were followed and measures were well implemented. Silt curtain systems were also inspected timely in accordance to the submitted plan. All inspection records were kept properly.
5.1.5 Acoustic decoupling measures on noisy plants on construction vessels were checked regularly and these measures were well implemented.
6
Summary
of Exceedances of the Environmental Quality Performance Limit
6.1 Summary of Exceedances of the Environmental Quality Performance Limit
6.1.1 For air quality monitoring, no Action/Limit Level exceedance of 1-hour TSP results was recorded in the reporting quarter. However, one (1) 24-hour TSP results exceeded the Action Level at monitoring station AMS7, three (3) 24-hour TSP results exceeded the Action Level at monitoring station AMS3A and two (2) 24-hour TSP result exceeded the Limit Level at monitoring station AMS3A. The investigation results showed that the action and limit level exceedances were non-project related.
6.1.2 For noise monitoring, due to one documented complaint is received; one (1) Action Level Exceedance of construction noise was recorded in the reporting quarter. The investigation results show that the action level exceedance was non-project related. No Limit Level Exceedance of construction noise was recorded in the reporting quarter.
6.1.3 For impact water quality monitoring, ten (10) Action Level exceedances were recorded at measured suspended solids (SS) values (in mg/L) in the reporting quarter, one (1) Limit Level exceedance was recorded at measured suspended solids (SS) values (in mg/L) in the reporting quarter and 1 Action Level exceedance was recorded at turbidity (NTU) in the reporting quarter. Investigation result show that the exceedances were not due to the Project works.
6.1.4 One (1) Limit level exceedance was recorded in the reporting quarter. The investigation results showed that there is no evidence that exceedances are related to Project works are annexed in Appendix L. Actions were taken according to the Event and Action Plan for impact dolphin monitoring. Please refer to Appendix L for details of action taken.
6.1.5 Cumulative statistics on exceedances is provided in Appendix J.
7
Summary
of Complaints, Notification of Summons and Successful Prosecutions
7.1 Summary of Environmental Compliants, Notification of Summons and Successful Prosecutions
7.1.1 The Environmental Complaint Handling Procedure is annexed in Figure 5.
7.1.2 One (1) complaint was referred by EPD to ET on 4 March 13 regarding the construction noise impact from cranes operating from the barges for the Hong Kong �VZhuhai-Macao Bridge Hong Kong Project generating squeak noise in the evening of 1 Mar 2013 causing annoyance to him/her. The investigation results show that the complaint was non-project related.
7.1.2.1 With refer to the site daily of 1 Mar 13 provided by the Contractor, 1 cranes operated at Zone S3 and S4 respectively and 4 cranes operated in Zone C of CNP No.RS0122-13 (please see attached Plan no.1 for respective zones). Squeak noise or other abnormal noise was unlikely to be generated by their operation on 1 Mar 13. Moreover, considering the distance between reclamation area and Tung Chung residential area is around 1.8 km, the noise to the residential area should be low.
7.1.2.2 As informed by the Contractor, the tug boats, derrick barges, pelican barges working at the site of HKBCF have been maintained in good working condition and no squeak nor other abnormal noise emitted will cause annoyance to any person at any noise sensitive receiver which in compliance with the CNP no. RS0122-13.
7.1.2.3 As a result, the noise complaint was considered as non-project related.
7.1.2.4 Nevertheless, the Contractor was reminded to maintain tug boats, derricks barges and pelican barges in good working conditions from which neither squeak nor other abnormal noise emitted was a source of annoyance to any person at any noise sensitive receiver.
7.1.3 One (1) complaint was referred by EPD on 8 April 13 regarding oil dumping observed from various vessels operating for HZMB HK projects near Tung Chung Development Pier over the past few months. The investigation results showed that the complaint was non-project related.
7.1.3.1 The concerned area is not the anchoring point for vessels of this contract. Vessels shown in EPD��s supporting document given via email on 8 April 13 are unlikely to belong to this contract.
7.1.3.2 Furthermore, no incident or leakage observation within HKBCF��s site boundary and its vicinity on 27 Jan, 2,3,17 and 24 Mar; and 7 Apr 13 was reported.
7.1.3.3 Precautionary measures are implemented by the Contractor to minimize the possibilities of accidental spillage of oil:
- Training record shows that related toolbox talk training such as handling and storage of chemical waste for workers and frontline staff are conducted regularly.
- In addition, all chemical waste arising from Contractor��s construction activities are packed, labeled and stored properly by the Contractor and collected by licensed waste collectors.
- Emergency drill for oil spillage was conducted on 8 August 2012 which allowed workers and frontline staff to familiar with the spill response procedures.
- As informed by the Contractor, all response action and incident reporting procedure would be carried out in compliance with the spill response plan if there is any accidental spillage of oil or chemical from construction activities of this contract.
- As informed by the Contractor, sufficient standard spill control materials are available on site for the removal of any oil leakage and refilling of the material will be provided when necessary.
-
7.1.3.4 After investigating the available information, the complaint was considered as not project-related.
7.1.3.5 The Contractor was recommended to continue implementing existing water quality mitigation measures.
7.1.3.6 Observation on a follow up visit made on 11 April 13 showed that there was no oil spillage observed from vessels of this Contract when carrying out joint site inspection audit.
7.1.3.7 As a result, the noise complaint was considered as non-project related.
7.1.4 One (1) complaint was referred by EPD on 23 May 13. This complaint was a follow-up of a previous complaint received by this Department on 8 April 2013 regarding oil dumping observed from various vessels operating for HZMB HK projects near Tung Chung Development Pier over the past few months.
7.1.4.1 The concerned area is not the anchoring point for vessels of this contract. Vessels shown in EPD��s supporting document given via email on 23 May 13 are unlikely to belong to this contract.
7.1.4.2 Furthermore, no incident or leakage observation within HKBCF��s site boundary and its vicinity on 27 Jan, 2,3,17 and 24 Mar; and 7 Apr 13 was reported.
7.1.4.3 Precautionary measures are implemented by the Contractor to minimize the possibilities of accidental spillage of oil:
- Training record shows that related toolbox talk training such as handling and storage of chemical waste for workers and frontline staff are conducted regularly.
- In addition, all chemical waste arising from Contractor��s construction activities are packed, labeled and stored properly by the Contractor and collected by licensed waste collectors.
- Emergency drill for oil spillage was conducted on 8 August 2012 which allowed workers and frontline staff to familiar with the spill response procedures.
- As informed by the Contractor, all response action and incident reporting procedure would be carried out in compliance with the spill response plan if there is any accidental spillage of oil or chemical from construction activities of this contract.
-
7.1.4.4 As informed by the Contractor, sufficient standard spill control materials are available on site for the removal of any oil leakage and refilling of the material will be provided when necessary.
7.1.4.5 After investigating the available information, the complaint was considered as not project-related.
7.1.4.6 The Contractor was recommended to continue implementing existing water quality mitigation measures.
7.1.5 As informed by the Contractor on 6 June 2013. A complaint referred to the Contractor by EPD on 10 May 2013 regarding the scattered debris of silt curtain noted at Sha Lo Wan and Tung Chung Bay. Immediate inspection and clean up action was taken by the Contractor.
7.1.6 As informed by the Contractor on 9 May 13, one summons was received on 29 April 13 regarding the suspected violation case of Noise Control Ordinance (Cap.400) at Works Area WA4 on 31 Oct 2012. The details of the non-compliance, investigation actions taken including follow-up site inspection conducted out by the ET and rectification actions and preventive actions provided by the Contractor was summarized at section 7 of the Quarterly EM&A summary report for September 2012 �V November 2012.
7.1.7 One (1) notification of summons was received in the reporting quarter.
7.1.8 No prosecution was received in the reporting quarter.
7.1.9 Statistics on complaints, notifications of summons and successful prosecutions are summarized in Appendix J.
8
Comments,
recommendations and Conclusions
8.1 Comments on mitigation measures
8.1.1 According to the environmental site inspections performed in the reporting quarter, the following recommendations were provided:
Air Quality Impact
l All working plants and vessels on site should be regularly inspected and properly maintained to avoid dark smoke emission.
l All vehicles should be washed to remove any dusty materials before leaving the site.
l Haul roads should be sufficiently dampened to minimize fugitive dust generation.
l Wheel washing facilities should be properly maintained and reviewed to ensure properly functioning.
l Temporary exposed slopes and open stockpiles should be properly covered.
l Enclosure should be erected for cement debagging, batching and mixing operations.
l Water spraying should be provided to suppress fugitive dust for any dusty construction activity.
Construction Noise Impact
l Quieter powered mechanical equipment should be used as far as possible.
l Noisy operations should be oriented to a direction away from sensitive receivers as far as possible.
l Proper and effective noise control measures for operating equipment and machinery on-site should be provided, such as erection of movable noise barriers or enclosure for noisy plants. Closely check and replace the sound insulation materials regularly
l Vessels and equipment operating should be checked regularly and properly maintained.
l Noise Emission Label (NEL) shall be affixed to the air compressor and hand-held breaker operating within works area.
l Better scheduling of construction works to minimize noise nuisance.
Water Quality Impact
l Regular review and maintenance of silt curtain systems, drainage systems and desilting facilities in order to make sure they are functioning effectively.
l Construction of seawall should be completed as early as possible.
l Regular inspect and review the loading process from barges to avoid splashing of material.
l Silt, debris and leaves accumulated at public drains, wheel washing bays and perimeter u-channels and desilting facilities should be cleaned up regularly.
l Silty effluent should be treated/ desilted before discharged. Untreated effluent should be prevented from entering public drain channel.
l Proper drainage channels/bunds should be provided at the site boundaries to collect/intercept the surface run-off from works areas.
l Exposed slopes and stockpiles should be covered up properly during rainstorm.
Chemical and Waste Management
l All types of wastes, both on land and floating in the sea, should be collected and sorted properly and disposed of timely and properly. They should be properly stored in designated areas within works areas temporarily.
l All chemical containers and oil drums should be properly stored and labelled.
l All plants and vehicles on site should be properly maintained to prevent oil leakage.
l All kinds of maintenance works should be carried out within roofed, paved and confined areas.
l All drain holes of the drip trays utilized within works areas should be properly plugged to avoid any oil and chemical waste leakage.
l Oil stains on soil surface and empty chemical containers should be cleared and disposed of as chemical waste.
l Regular review should be conducted for working barges and patrol boats to ensure sufficient measures and spill control kits were provided on working barges and patrol boats to avoid any spreading of leaked oil/chemicals.
Landscape and Visual Impact
l All existing, retained/transplanted trees at the works areas should be properly fenced off and regularly inspected.
8.2 Recommendations on EM&A Programme
8.2.1 The impact monitoring programme for air quality, noise, water quality and dolphin ensured that any deterioration in environmental condition was readily detected and timely actions taken to rectify any non-compliance. Assessment and analysis of monitoring results collected demonstrated the environmental impacts of the Project. With implementation of recommended effective environmental mitigation measures, the Project��s environmental impacts were considered as environmentally acceptable. The weekly environmental site inspections ensured that all the environmental mitigation measures recommended were effectively implemented.
8.2.2 The recommended environmental mitigation measures, as included in the EM&A programme, effectively minimize the potential environmental impacts from the Project. Also, the EM&A programme effectively monitored the environmental impacts from the construction activities and ensure the proper implementation of mitigation measures. No particular recommendation was advised for the improvement of the programme.