table of Contents
lExecutive Summary
1.1 Background
1.2 Scope of Report
1.3 Organization Structure
1.4 Summary of Construction Works
2.1 Air quality
2.2 Water Quality Monitoring
2.3 Dolphin Monitoring
2.4 EM&A Site Inspection
2.5 Waste Management Status
2.6 Environmental Licenses and Permits
2.7 Implementation Status of Environmental Mitigation Measures
2.8 Summary of Exceedances of the Environmental Quality Performance Limit
2.9 Summary of Complaints, Notification of Summons and Successful Prosecutions
2.10 Comparison of EM&A Data with EIA Predictions
2.11 Summary of Monitoring Methodology and Effectiveness
2.12 Summary of Mitigation Measures
3.1 Site Inspections & Audits
3.2 Air Quality Monitoring
3.3 Marine Water Quality Monitoring
3.4 Waste Management
3.5 Marine Ecology Monitoring
3.6 Summary of Recommendations
Appendix
A
Project Organization
Appendix
B
Environmental
Mitigation And Enhancement Measure Implementation Schedules (EMIS)
Appendix
C
Action And Limit
Levels
Appendix
D
Air Quality Monitoring
Results
Appendix
E
Water Quality
Monitoring Results
Appendix
F
Impact Dolphin
Monitoring
Appendix G
Event And Action Plan
Appendix
H
Cumulative Statistics
On Exceedance And Complaint
Appendix
I
Waste Flow Table
Executive
Summary
Under Contract No. HY/2012/08, Dragages – Bouygues Joint Venture (DBJV) is commissioned by the Highways Department (HyD) to undertake the design and construction of the Northern Connection Sub-sea Tunnel Section of the Tuen Mun – Chek Lap Kok Link Project (TM-CLK Link Project) while AECOM Asia Company Limited was appointed by HyD as the Supervising Officer. For implementation of the environmental monitoring and audit (EM&A) programme under the Contract, ERM-Hong Kong, Limited (ERM) has been appointed as the Environmental Team (ET) in accordance with Environmental Permit No. EP-354/2009/A. Ramboll Hong Kong Limited was employed by HyD as the Independent Environmental Checker (IEC) and Environmental Project Office (ENPO). Subsequent applications for variation of environmental permits (VEP), EP-354/2009/B, EP-354/2009/C and EP-354/2009/D, were granted on 28 January 2014, 10 December 2014 and 13 March 2015, respectively.
The construction phase of the Contract commenced on 1 November 2013 and will tentatively be completed by the end of 2019. The impact monitoring of the EM&A programme, including air quality, water quality, marine ecological monitoring and environmental site inspections, were commenced on 1 November 2013.
This is the Fifth Annual EM&A report presenting the EM&A works carried out during the period from 1 November 2017 to 31 October 2018 for the Contract No. HY/2012/08 Northern Connection Sub-sea Tunnel Section (the “Contract ”) in accordance with the Updated EM&A Manual of the TM-CLK Link Contract . As informed by the Contractor, the major activities in the reporting year included:
|
Construction Activities Undertaken |
|
Land-based Works |
|
· Box Culvert Extension at Works Area – Portion N-A; · Construction of North Ventilation Building – Portion N-C; · Construction of Cross Passage Tympanum – TBM tunnel; · Cross Passage Lining Installation – TBM Tunnel; · Cross Passage Construction by Pipe Jacking – TBM Tunnel; · Excavation of Sub-sea Tunnel – TBM tunnel; · Corbel & OVHD Construction – TBM Tunnel; · Parapet wall Installation – TBM Tunnel; · Phase 2 Surcharge Removal – Portion N-A; · Bulk Excavation – Portion S-A; · CSM treatment, Jet Grouting works and D-wall Construction; and · Ground Freezing Works – Portion S-A
Marine-based Works · Seawall Construction and Filling works – Portion N-A; and · Seawall Enhancement works – Portion N-C |
A summary of monitoring and audit activities conducted in the reporting period is listed below:
24-hour TSP Monitoring 120 sessions
1-hour TSP Monitoring 120 sessions
Water Quality Monitoring 26 sessions
Impact Dolphin Monitoring 24 sessions
Joint Environmental Site Inspection 53 sessions
Implementation of Marine Mammal Exclusion Zone
Daily marine mammal exclusion zone was in effect during the period of dredging, reclamation or marine sheet piling works in open waters under this Contract. Passive Acoustic Monitoring (PAM) was also implemented for the detection of marine mammal when dredging, reclamation or marine sheet piling works were carried out outside the daylight hours under this Contract. No sighting of the Indo-Pacific humpback dolphin Sousa chinensis (i.e. Chinese White Dolphin) was recorded in the reporting period during the exclusion zone monitoring.
Summary of Breaches of Action/Limit Levels
Breaches of Action and Limit Levels for Air Quality
Twenty-nine (29) Action Level exceedances of 1-hour TSP, two (2) Limit Level exceedances of 1-hour TSP, two (2) Action Level exceedances of 24-hour TSP and three (3) Limit Level exceedances of 24-hour TSP were recorded in the air quality monitoring of this reporting period.
Breaches of Action and Limit Levels for Water Quality
Fourteen (14) Action Level exceedances were recorded from the water quality monitoring in this reporting period.
Dolphin Monitoring
Whilst two (2) Action Level and three (3) Limit Level exceedances were recorded for four (4) sets of quarterly dolphin monitoring data between November 2017 and October 2018, no unacceptable impact from the construction activities of the TM-CLKL Northern Connection Sub-sea Tunnel Section on Chinese White Dolphins was noticeable from general observations during dolphin monitoring in this reporting period.
Environmental Complaints, Non-compliance & Summons
No non-compliance with EIA recommendations, EP conditions and other requirements associated with the construction of this Contract was recorded in this reporting period.
One (1) environmental complaint case was received in this reporting period. The investigation reports were submitted to ENPO and reported in the subsequent EM&A reports.
No environmental summons was received in this reporting period.
Review of EM&A programme
The EM&A requirements have been reviewed and were considered as adequate and effective. No change to the requirements was considered to be necessary. The recommended environmental mitigation measures were also considered to be effective and efficient in reducing the potential environmental impacts associated with the construction of the Contract. No change was thus considered necessary.
Overall, the EM&A results indicated that the Contract has not caused unacceptable environmental impacts. This is in agreement with the assessment presented in the EIA Report.
1.1
Background
According to the findings of the Northwest New Territories (NWNT) Traffic and Infrastructure Review conducted by the Transport Department, Tuen Mun Road, Ting Kau Bridge, Lantau Link and North Lantau Highway would be operating beyond capacity after 2016. This forecast has been based on the estimated increase in cross boundary traffic, developments in the Northwest New Territories (NWNT), and possible developments in North Lantau, including the Airport developments, the Lantau Logistics Park (LLP) and the Hong Kong – Zhuhai – Macao Bridge (HZMB). In order to cope with the anticipated traffic demand, two new road sections between NWNT and North Lantau – Tuen Mun – Chek Lap Kok Link (TM-CLKL) and Tuen Mun Western Bypass (TMWB) are proposed.
An Environmental Impact Assessment (EIA) of TM-CLKL (the Project) was prepared in accordance with the EIA Study Brief (No. ESB-175/2007) and the Technical Memorandum of the Environmental Impact Assessment Process (EIAO-TM). The EIA Report was submitted under the Environmental Impact Assessment Ordinance (EIAO) in August 2009. Subsequent to the approval of the EIA Report (EIAO Register Number AEIAR-146/2009), an Environmental Permit (EP-354/2009) for TM-CLKL was granted by the Director of Environmental Protection (DEP) on 4 November 2009, and EP variation (VEP) (EP-354/2009A) was issued on 8 December 2010. Subsequent applications for variation of environmental permits (VEP), EP-354/2009/B, EP-354/2009/C and EP-354/2009/D, were granted on 28 January 2014, 10 December 2014 and 13 March 2015, respectively.
Under Contract No. HY/2012/08, Dragages – Bouygues Joint Venture (DBJV) is commissioned by the Highways Department (HyD) to undertake the design and construction of the Northern Connection Sub-sea Tunnel Section of TM-CLKL while AECOM Asia Company Limited was appointed by HyD as the Supervising Officer. For implementation of the environmental monitoring and audit (EM&A) programme under the Contract, ERM-Hong Kong, Limited (ERM) has been appointed as the Environmental Team (ET). Ramboll Hong Kong Limited was employed by HyD as the Independent Environmental Checker (IEC) and Environmental Project Office (ENPO).
Layout of the Contract components is presented in Figure 1.1.
The
construction phase of the Contract commenced on 1 November 2013 and will tentatively
be completed by 2020. The impact monitoring phase of the EM&A
programme, including air quality, water quality, marine ecological monitoring
and environmental site inspections, were commenced on 1 November 2013.
1.2
Scope
of Report
This is the
Fifth Annual EM&A Report under the Contract No. HY/2012/08 Tuen
Mun – Chek Lap Kok Link – Northern Connection Sub-sea Tunnel Section.
This report presents a summary of the environmental monitoring and audit works
from 1 November 2017 to 31 October 2018.
The organization structure of the Contract is shown in Appendix A. The key personnel contact names and contact details are summarized in Table 1.1 below.
Table 1.1 Contact Information of Key Personnel
|
Party |
Position |
Name |
Telephone |
Fax |
|
Highways Department
|
Engr 22/HZMB |
Chow Man Lung, Andrew |
2762 4110 |
2762 4110 |
|
SOR (AECOM Asia Company Limited)
|
Chief Resident Engineer |
Roger Man
Andrew Westmoreland
|
2293 6388
2293 6360 |
2293 6300
2293 6300 |
|
ENPO / IEC (Ramboll Hong Kong Ltd.) |
ENPO Leader
|
Y.H. Hui |
3465 2850 |
3465 2899 |
|
IEC
|
Dr. F.C. Tsang |
3465 2851 |
3465 2899 |
|
|
Contractor (Dragages – Bouygues Joint Venture) |
Deputy Environmental Manager |
Bryan Lee
|
2293 7323
|
2293 7499 |
|
|
Senior Environmental Officer |
Ashley Au |
52950766 |
|
|
|
24-hour hotline
|
|
2293 7330 |
|
|
ET (ERM-HK) |
ET Leader |
Jasmine Ng |
2271 3311 |
2723 5660 |
1.4
Summary of Construction Works
With
reference to DBJV’s information, details of major construction works carried
out in this reporting period are summarized in Table 1.2.
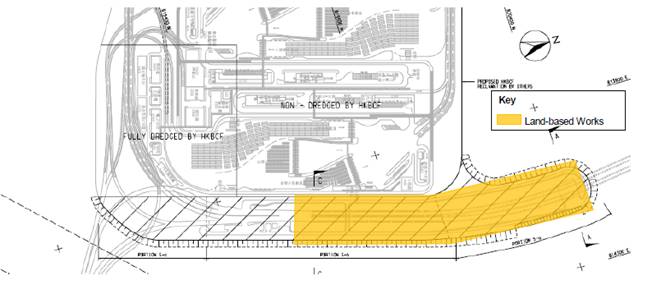
The general layout plan of the site showing the detailed works areas is shown in Figure 1.2. The Environmental Sensitive Receivers in the vicinity of the Project are shown in Figure 1.3.
The implementation schedule of environmental mitigation
measures is presented in Appendix B.
Table 1.2 Summary of Construction Activities Undertaken during the Reporting Period
|
||||||||||||
Figure 1.2 Locations of Construction Activities – November 2017 to October 2018
|
|
The EM&A programme required environmental monitoring for air quality, water quality and marine ecology as well as environmental site inspections for air quality, noise, water quality, waste management, marine ecology and landscape and visual impacts. The EM&A requirements and related findings for each component are summarized in the following sections
2.1
Air
quality
2.1.1
Monitoring
Requirements and Equipment
In accordance with the Updated EM&A Manual and the Enhanced TSP Monitoring Plan ([1]), impact 1-hour TSP monitoring was conducted three (3) times in every six (6) days and impact 24-hour TSP monitoring was carried out once in every six (6) days when the highest dust impact was expected. 1-hr and 24-hr TSP monitoring frequency was increased to three times per day every three days and daily every three days respectively as excavation works for launching shaft commenced on 24 October 2014.
High volume samplers (HVSs) were used to carry out the 1-hour and 24-hour TSP monitoring in the reporting period at the five (5) air quality monitoring stations in accordance with the requirements stipulated in the Updated EM&A Manual (Figure 2.1; Table 2.1). Wind anemometer was installed at the rooftop of ASR5 for logging wind speed and wind direction. Details of the equipment deployed are provided in Table 2.2.
Table 2.1 Locations of Impact Air Quality Monitoring Stations and Monitoring Dates in this Reporting Period
|
Monitoring Station |
Location |
Description |
Parameters & Frequency |
|
ASR1 |
Tuen Mun Fireboat Station |
Office |
TSP monitoring Ÿ 1-hour Total Suspended Particulates (1-hour TSP, µg/m3), 3 times in every 6 days Ÿ 24-hour Total Suspended Particulates (24-hour TSP, µg/m3), daily for 24-hour in every 6 days Enhanced TSP monitoring (commenced on 24 October 2014) Ÿ 1-hour Total Suspended Particulates (1-hour TSP, µg/m3), 3 times in every 3 days Ÿ 24-hour Total Suspended Particulates (24-hour TSP, µg/m3), daily for 24-hour in every 3 days |
|
ASR5 |
Pillar Point Fire Station |
Office |
|
|
AQMS1 |
Previous River Trade Golf |
Bare ground |
|
|
AQMS2/ASR6 |
Bare ground at Ho Suen Street /Butterfly Beach Laundry |
Bare ground/Office |
|
|
ASR10 |
Butterfly Beach Park |
Recreational uses |
*Notes: AQMS2 was relocated and HVS was re-installed at ASR6 (Butterfly Beach Laundry) on 17 January 2014. AQMS2 was then superseded by ASR6 for the impact air quality monitoring. Impact air quality monitoring at ASR6 commenced on 21 January 2014.
Table 2.2 Air Quality Monitoring Equipment
|
Equipment |
Brand and Model |
|
High
Volume Sampler |
Tisch Environmental Mass Flow Controlled Total Suspended Particulate (TSP) High Volume Sampler (Model No. TE-5170)
|
|
Wind Meter |
Davis (Model: Weather Wizard III (S/N: WE90911A30) Davis (Model: Vantage Pro 2 (S/N: AS160104014 |
|
Wind Anemometer for calibration |
Lutron (Model No. AM-4201) |
The Action and Limit Levels of the air quality monitoring are provided in Appendix C. The Event and Action plan is presented in Appendix G.
2.1.3
Results
and Observations
Impact air quality monitoring was conducted at all designated monitoring stations in the reporting period under acceptable weather conditions. The major dust sources in the reporting period include construction activities under the Contract and Contract No. HY/2013/12 as well as nearby traffic emissions.
The monitoring results for 1-hour TSP and 24-hour TSP are summarized in Tables 2.3 and 2.4, respectively. Baseline and impact monitoring results are presented graphically in Appendix D. The detailed impact air quality monitoring data and meteorological information were reported in the Thirty-seventh to Forty-eighth Monthly EM&A Report.
Table 2.3 Summary of 1-hour TSP Monitoring Results in this Reporting Period
|
Month/Year |
Station |
Average (µg/m3) |
Range (µg/m3) |
Action Level (µg/m3) |
Limit Level (µg/m3) |
|
November 2017 to October 2018 |
ASR 1 |
138 |
13 - 584 |
331 |
500 |
|
ASR 5 |
167 |
13 - 455 |
340 |
500 |
|
|
AQMS1 |
99 |
14 - 324 |
335 |
500 |
|
|
ASR6 |
123 |
13 - 335 |
338 |
500 |
|
|
ASR10 |
87 |
13 - 816 |
337 |
500 |
Table 2.4 Summary of 24-hour TSP Monitoring Results in this Reporting Period
|
Month/Year |
Station |
Average (µg/m3) |
Range (µg/m3) |
Action Level (µg/m3) |
Limit Level (µg/m3) |
|
November 2017 to October 2018 |
ASR 1 |
89 |
19 - 328 |
213 |
260 |
|
ASR 5 |
100 |
23 - 279 |
238 |
260 |
|
|
AQMS1 |
64 |
16 - 207 |
213 |
260 |
|
|
ASR6 |
77 |
18 - 178 |
238 |
260 |
|
|
ASR10 |
59 |
17 - 250 |
214 |
260 |
In this reporting period, a total of 120 monitoring events were undertaken. Twenty-nine (29) Action Level exceedances of 1-hour TSP, two (2) Limit Level exceedances of 1-hour TSP, two (2) Action Level exceedances of 24-hour TSP and three (3) Limit Level exceedances of 24-hour TSP were recorded. Summary of exceedances for Air Quality Impact Monitoring in this reporting period is detailed in Table 2.24.
As shown in Table 2.5, the annual average 1-hour TSP and 24-hour TSP level in the reporting period were generally lower than the corresponding average levels of baseline at most monitoring stations. The annual average 1-hour TSP was higher than the corresponding average levels of baseline at ASR1 and ASR5.
In order to determine any significant air quality impacts caused by construction activities from this Contract, one-way ANOVA (with setting α at 0.05) was conducted to examine whether the observed differences are significant between reporting period and baseline monitoring. For 1-hour TSP, the average results of monitoring stations AQMS1 and ASR10 in the reporting period were significantly lower than the average results of baseline monitoring while the average result of ASR6 is slightly lower than the average results of baseline monitoring. The average results of monitoring stations ASR1 and ASR5 in the reporting period were slightly higher than the average results of baseline monitoring (AQMS1: F 1, 401 = 21.49, p < 0.01, ASR6: F 1, 401 = 1.74, p = 0.19, ASR1: F 1, 401 = 0.98, p = 0.32, ASR10: F 1, 401 = 19.3, p < 0.01 and ASR5: F 1, 401 = 5.67 p = 0.018). For 24-hour TSP, the average results of all monitoring stations in the reporting period were significantly lower than the average results of baseline monitoring (AQMS1: F 1, 130 = 53.21, p < 0.01, ASR6: F 1, 130 = 85.79, p < 0.01, ASR1: F 1, 130 = 7.92, p < 0.01, ASR10: F 1, 130 = 52.43, p < 0.01 and ASR5: F 1, 130 = 27.73, p < 0.01). In the reporting period, 1-hour and 24-hour TSP were varied across sampling months (see Appendix D) and these variations were however not consistent throughout the reporting period.
Table 2.5 Summary of Average Levels of TSP Level of Baseline Monitoring and Reporting Period (in µg/m3)
|
Monitoring Station |
Average Baseline Monitoring |
Average Impact Monitoring |
|
ASR1(1-hour TSP) |
125 |
138 |
|
ASR1(24-hour TSP) |
128 |
89 |
|
ASR5(1-hour TSP) |
138 |
167 |
|
ASR5(24-hour TSP) |
167 |
100 |
|
AQMS1(1-hour TSP) |
131 |
99 |
|
AQMS1(24-hour TSP) |
127 |
64 |
|
ASR6(1-hour TSP) |
135 |
123 |
|
ASR6(24-hour TSP) |
166 |
77 |
|
ASR10(1-hour TSP) |
134 |
87 |
|
ASR10(24-hour TSP) |
129 |
59 |
Further to the One-way ANOVA, Linear Regression was conducted to examine any relationship between TSP levels and time (i.e. number of days after construction works commencement) during this yearly monitoring period at each monitoring station. Linear regression analysis makes assumptions of equal variance and normal distribution of data. Therefore, the significance level of the test was set at 1 % (i.e. p = 0.01) to reduce the chance of committing a Type 1 error. If a significant regression relationship was found between TSP level and time (i.e. p < 0.01), r2 value from the analysis would be further assessed. This value represents the proportion of the total variation in the dependent variable (i.e. TSP level) that is accounted for by the fitted regression line and is referred to as the coefficient of determination. An r2 value of 1 indicates a perfect relationship (or fit) whereas a value of 0 indicates that there is no relationship (or no fit) between the dependent and independent variables. As there are no specific criteria to indicate how meaningful an r2 value is, for the purposes of this EM&A programme a value of 0.60 was adopted to indicate a meaningful regression. If r2 < 0.60 then it was considered that there was a weak relationship between TSP level and time or none at all. If the regression analysis indicated r2 > 0.60 then it had been interpreted that there was in fact a strong relationship between the dependent and independent variables (i.e. a strong temporal trend of increasing / decreasing TSP level with time).
As shown in Table 2.6, results of the regression analysis indicated that there was no significant (r2 < 0.60) relationship between TSP level and time during this yearly monitoring period. As such, it is considered that there is no apparent trend of increasing / decreasing TSP level during the reporting period.
Table 2.6 Linear Regression Result of TSP Monitoring
|
Parameter |
Station |
R2 |
F-ratio |
p-value |
Intercept |
Coefficient |
|
1-hour TSP |
AQMS1 |
0.051 |
F1,358 = 19.0 |
<0.001 |
249.5 |
-0.092 |
|
AQMS2/ASR6 |
0.043 |
F1,358 = 15.9 |
<0.001 |
317.1 |
-0.119 |
|
|
ASR1 |
0.023 |
F1,358 = 8.44 |
<0.001 |
339.1 |
-0.123 |
|
|
ASR10 |
0.094 |
F1,358 = 37.2 |
<0.001 |
401.1 |
-0.192 |
|
|
ASR5 |
0.034 |
F1,358 = 12.60 |
<0.001 |
391.6 |
-0.137 |
|
|
24-hour TSP |
AQMS1 |
0.191 |
F1,115 = 26.9 |
<0.001 |
247.4 |
-0.112 |
|
AQMS2/ASR6 |
0.152 |
F1,115 = 20.51 |
<0.001 |
278.9 |
-0.123 |
|
|
|
ASR1 |
0.218 |
F1,115 = 31.7 |
<0.001 |
437.2 |
-0.212 |
|
|
ASR10 |
0.215 |
F1,115 = 31.3 |
<0.001 |
289.9 |
-0.141 |
|
|
ASR5 |
0.126 |
F1,115 = 16.42 |
<0.001 |
337.3 |
-0.145 |
Note:
1. Dependent variable is set as TSP levels (in µg/m3) and independent variable is set as number of day of construction works.
2. R2 <0.6 and p-value >0.01 (i.e. showing the regression insignificant) are underlined.
The baseline water quality monitoring undertaken by the Hong Kong – Zhuhai – Macao Bridge Hong Kong Projects (HZMB) between 6 and 31 October 2011 included all monitoring stations for the Project. Thus, the baseline monitoring results and Action/Limit Levels presented in HZMB Baseline Monitoring Report ([2]) are adopted for this Project.
2.2.1
Monitoring
Requirements & Equipment
In accordance with the Updated EM&A Manual, impact water quality monitoring was carried out three (3) days per week during the construction period at nine (9) water quality monitoring stations (Figure 2.2; Table 2.7).
Table 2.7 Locations of Water Quality
Monitoring Stations and the Corresponding
Monitoring Requirements
|
Station ID |
Type |
Coordinates |
*Parameters, unit |
Depth |
Frequency |
|
|
|
|
Easting |
Northing |
|
|
|
|
IS12 |
Impact Station |
813218 |
823681 |
Ÿ Temperature(°C) Ÿ pH(pH unit) Ÿ Turbidity (NTU) Ÿ Water depth (m) Ÿ Salinity (ppt) Ÿ DO (mg/L and % of saturation) · SS (mg/L) |
3 water depths: 1m below sea surface, mid-depth and 1m above sea bed. If the water depth is less than 3m, mid-depth sampling only. If water depth less than 6m, mid-depth may be omitted.
|
Impact monitoring: 3 days per week, at mid-flood and mid-ebb tides during the construction period of the Contract. |
|
IS13 |
Impact Station |
813667 |
824325 |
|||
|
IS14 |
Impact Station |
812592 |
824172 |
|||
|
IS15 |
Impact Station |
813356 |
825008 |
|||
|
CS4 |
Control / Far Field Station |
810025 |
824004 |
|||
|
CS6 |
Control / Far Field Station |
817028 |
823992 |
|||
|
SR8 |
Sensitive receiver (Gazettal beaches in Tuen Mun) |
816306 |
825715 |
|||
|
SR9 |
Sensitive
receiver |
813601 |
825858 |
|||
|
SR10A |
Sensitive
receiver |
823741 |
823495 |
|||
|
*Notes: In addition to the parameters presented monitoring location/position, time, water depth, sampling depth, tidal stages, weather conditions and any special phenomena or works underway nearby were also recorded. |
||||||
Table 2.8 summarizes the equipment used in the impact water quality monitoring programme.
Table 2.8 Water Quality Monitoring Equipment
|
Equipment |
Model |
Qty. |
|
Water Sampler |
Kahlsico Water-Bottle Model 135DW 150 |
1 |
|
Dissolved Oxygen Meter |
YSI Pro 2030 |
1 |
|
pH Meter |
HANNA HI 9125 |
1 |
|
Turbidity Meter |
HACH 2100Q |
1 |
|
Monitoring Position Equipment |
“Magellan” Handheld GPS Model explorist GC |
4 |
|
DGPS Koden KGP913MK2 (1) |
1 |
2.2.2
Action
& Limit Levels
The Action and Limit Levels of the water quality monitoring is provided in Appendix C. The Event and Action plan is presented in Appendix G.
2.2.3
Results
and Observations
During this reporting period, major marine works included Seawall Construction, Filling works and Seawall Enhancement works. Seawall Enhancement Works at Northern Landfall has been completed on 31 December 2017.
Impact water quality monitoring was conducted at all designated monitoring stations in the reporting period under favourable weather conditions. Baseline and impact monitoring results are presented graphically in Appendix E and detailed impact water quality monitoring data were reported in the forty-ninth to Fiftieth Monthly EM&A Report. Water Quality Monitoring was suspended from 31 December 2017 effectively.
In this reporting period, a total of 26 monitoring events were undertaken in which fourteen (14) Action Level exceedances were recorded from the water quality monitoring in this reporting period. Summary of exceedances for Water Quality Impact Monitoring in this reporting period is detailed in Table 2.25.
In order to determine any significant water quality impacts caused by construction activities from this Contract, One-way ANOVA (with setting α at 0.05) was conducted to examine whether there was significant difference in DO, turbidity and SS between reporting period and baseline monitoring period. The annual average levels and statistical analysis results are presented in Tables 2.9 to 2.11 and Tables 2.12 to 2.14, respectively. In general, the DO levels recorded during the reporting period were significantly higher than the results obtained during the baseline monitoring period. The annual depth-averaged turbidity recorded in the reporting period were significantly lower than the average levels in baseline monitoring, except for IS13 in mid-ebb tide and IS13, IS14, IS15 and SR10A in mid-flood tide in which the turbidity levels recorded during the baseline monitoring period were higher than the corresponding average baseline levels. The SS levels recorded during the reporting period were significantly lower than the results obtained during the baseline monitoring period, except for IS12 and IS13 in mid-ebb tide and IS12, IS13, IS14 and SR9 in mid-flood tide in which the SS levels recorded during the baseline monitoring period were higher than the corresponding average baseline levels. Whilst DO, turbidity and suspended solids levels were varied across sampling months (see Appendix E) these variations were, however, not consistent throughout the reporting period.
Table 2.9 Summary of Average DO Level of Baseline Monitoring and the Reporting Period (in mg/L)
|
Tide |
Station |
Depth |
Average DO of baseline monitoring |
Average DO of reporting period |
|
Mid-ebb |
IS12 |
Surface |
6.1 |
6.5 |
|
IS13 |
Surface |
6.1 |
6.5 |
|
|
IS14 |
Surface |
6.1 |
6.5 |
|
|
IS15 |
Surface |
6.1 |
6.5 |
|
|
SR10A |
Surface |
6.0 |
6.4 |
|
|
SR8 |
Surface |
6.2 |
6.5 |
|
|
SR9 |
Surface |
6.0 |
6.5 |
|
|
Mid-flood |
IS12 |
Surface |
6.1 |
6.6 |
|
IS13 |
Surface |
6.1 |
6.5 |
|
|
IS14 |
Surface |
6.1 |
6.5 |
|
|
IS15 |
Surface |
6.2 |
6.5 |
|
|
SR10A |
Surface |
6.0 |
6.5 |
|
|
SR8 |
Surface |
6.2 |
6.6 |
|
|
SR9 |
Surface |
6.0 |
6.5 |
|
|
Mid-ebb |
IS12 |
Middle |
5.9 |
6.4 |
|
IS13 |
Middle |
6.0 |
6.4 |
|
|
IS14 |
Middle |
6.0 |
6.4 |
|
|
IS15 |
Middle |
6.0 |
6.4 |
|
|
SR10A |
Middle |
5.9 |
6.4 |
|
|
Mid-flood |
IS12 |
Middle |
5.9 |
6.5 |
|
IS13 |
Middle |
6.0 |
6.5 |
|
|
IS14 |
Middle |
5.9 |
6.4 |
|
|
IS15 |
Middle |
6.1 |
6.5 |
|
|
SR10A |
Middle |
5.9 |
6.5 |
|
|
Mid-ebb |
IS12 |
Bottom |
5.9 |
6.4 |
|
IS13 |
Bottom |
5.9 |
6.4 |
|
|
IS14 |
Bottom |
5.9 |
6.4 |
|
|
IS15 |
Bottom |
5.9 |
6.5 |
|
|
SR10A |
Bottom |
5.7 |
6.4 |
|
|
SR8 |
Bottom |
6.0 |
6.5 |
|
|
SR9 |
Bottom |
5.8 |
6.5 |
|
|
Mid-flood |
IS12 |
Bottom |
5.9 |
6.5 |
|
IS13 |
Bottom |
5.9 |
6.5 |
|
|
IS14 |
Bottom |
5.9 |
6.4 |
|
|
IS15 |
Bottom |
6.0 |
6.5 |
|
|
SR10A |
Bottom |
5.8 |
6.5 |
|
|
SR8 |
Bottom |
5.8 |
6.6 |
|
|
SR9 |
Bottom |
5.9 |
6.5 |
Table 2.10 Summary of Average Depth-averaged Turbidity Level of Baseline Monitoring and the Reporting Period (in NTU)
|
Tide |
Station |
Average depth-averaged turbidity of baseline monitoring |
Average depth-averaged turbidity of reporting period |
|
Mid-ebb |
IS12 |
10.7 |
7.6 |
|
IS13 |
9.2 |
9.6 |
|
|
IS14 |
9.3 |
8.5 |
|
|
IS15 |
9.8 |
6.0 |
|
|
SR10A |
7.1 |
5.3 |
|
|
|
SR8 |
11.0 |
7.2 |
|
|
SR9 |
7.2 |
6.3 |
|
Mid-flood |
IS12 |
9.8 |
8.5 |
|
IS13 |
9.5 |
10.3 |
|
|
IS14 |
9.4 |
11.6 |
|
|
IS15 |
9.8 |
11.0 |
|
|
SR10A |
7.0 |
7.1 |
|
|
|
SR8 |
10.1 |
7.9 |
|
|
SR9 |
8.5 |
7.5 |
Table 2.11 Summary of Average Depth-averaged SS Level of Baseline Monitoring and the Reporting Period (in mg/L)
|
Tide |
Station |
Average depth-averaged SS of baseline monitoring |
Average depth-averaged SS of reporting period |
|
Mid-ebb |
IS12 |
9.2 |
10.3 |
|
IS13 |
10.0 |
10.3 |
|
|
IS14 |
10.4 |
8.6 |
|
|
IS15 |
9.6 |
7.7 |
|
|
SR10A |
10.3 |
7.4 |
|
|
|
SR8 |
10.1 |
8.5 |
|
|
SR9 |
8.8 |
7.8 |
|
Mid-flood |
IS12 |
9.5 |
10.0 |
|
IS13 |
10.5 |
12.1 |
|
|
IS14 |
9.7 |
13.7 |
|
|
IS15 |
11.0 |
13.4 |
|
|
SR10A |
10.2 |
9.8 |
|
|
|
SR8 |
11.3 |
10.7 |
|
|
SR9 |
9.9 |
10.0 |
Table 2.12 One-way ANOVA Results for DO Comparison between Impact and Baseline Periods
|
Tide |
Station |
Depth |
F ratio |
p-value |
|
Mid-ebb |
IS12 |
Surface |
F1,37 = 3.69 |
0.06 |
|
Mid-ebb |
IS13 |
Surface |
F1,37 = 3.38 |
0.07 |
|
Mid-ebb |
IS14 |
Surface |
F1,37 = 2.55 |
0.12 |
|
Mid-ebb |
IS15 |
Surface |
F1,37 = 2.51 |
0.12 |
|
Mid-ebb |
SR10A |
Surface |
F1,37 = 3.05 |
0.09 |
|
Mid-ebb |
SR8 |
Surface |
F1,37 = 1.25 |
0.27 |
|
Mid-ebb |
SR9 |
Surface |
F1,37 = 4.47 |
0.04 |
|
Mid-flood |
IS12 |
Surface |
F1,37 = 5.04 |
0.03 |
|
Mid-flood |
IS13 |
Surface |
F1,36 = 3.28 |
0.08 |
|
Mid-flood |
IS14 |
Surface |
F1,37 = 2.79 |
0.10 |
|
Mid-flood |
IS15 |
Surface |
F1,37 = 1.58 |
0.22 |
|
Mid-flood |
SR10A |
Surface |
F1,37 = 6.72 |
0.01 |
|
Mid-flood |
SR8 |
Surface |
F1,37 = 3.05 |
0.09 |
|
Mid-flood |
SR9 |
Surface |
F1,37 = 3.93 |
0.06 |
|
Mid-ebb |
IS12 |
Middle |
F1,37 = 4.13 |
0.05 |
|
Mid-ebb |
IS13 |
Middle |
F1,37 = 2.69 |
0.11 |
|
Mid-ebb |
IS14 |
Middle |
F1,37 = 3.32 |
0.08 |
|
Mid-ebb |
IS15 |
Middle |
F1,37 = 3.13 |
0.09 |
|
Mid-ebb |
SR10A |
Middle |
F1,37 = 5.60 |
0.02 |
|
Mid-flood |
IS12 |
Middle |
F1,37 = 5.98 |
0.02 |
|
Mid-flood |
IS13 |
Middle |
F1,37 = 4.44 |
0.04 |
|
Mid-flood |
IS14 |
Middle |
F1,37 = 4.25 |
0.05 |
|
Mid-flood |
IS15 |
Middle |
F1,37 = 2.48 |
0.12 |
|
Mid-flood |
SR10A |
Middle |
F1,37 = 12.1 |
<0.01 |
|
Mid-ebb |
IS12 |
Bottom |
F1,37 = 4.42 |
0.04 |
|
Mid-ebb |
IS13 |
Bottom |
F1,37 = 4.36 |
0.04 |
|
Mid-ebb |
IS14 |
Bottom |
F1,37 = 344 |
0.07 |
|
Mid-ebb |
IS15 |
Bottom |
F1,37 = 5.96 |
0.02 |
|
Mid-ebb |
SR10A |
Bottom |
F1,37 = 13.8 |
<0.01 |
|
Mid-ebb |
SR8 |
Bottom |
F1,37 = 4.42 |
0.04 |
|
Mid-ebb |
SR9 |
Bottom |
F1,37 = 9.29 |
<0.01 |
|
Mid-flood |
IS12 |
Bottom |
F1,37 = 7.12 |
0.01 |
|
Mid-flood |
IS13 |
Bottom |
F1,37 = 6.27 |
0.02 |
|
Mid-flood |
IS14 |
Bottom |
F1,37 = 4.82 |
0.03 |
|
Mid-flood |
IS15 |
Bottom |
F1,37 = 4.12 |
0.05 |
|
Mid-flood |
SR10A |
Bottom |
F1,37 = 12.2 |
<0.01 |
|
Mid-flood |
SR8 |
Bottom |
F1,37 = 12.1 |
<0.01 |
|
Mid-flood |
SR9 |
Bottom |
F1,37 = 5.1 |
0.03 |
|
Note: By setting α at 0.05, significant differences (p-value < 0.05) are bold. |
||||
Table 2.13 One-way ANOVA Results for Depth-averaged Turbidity Comparison between Impact and Baseline Periods
|
Tide |
Station |
F ratio |
p-value |
|
Mid-ebb |
IS12 |
F1,37 = 3.68 |
0.06 |
|
Mid-ebb |
IS13 |
F1,37 = 0.07 |
0.80 |
|
Mid-ebb |
IS14 |
F1,37 = 0.25 |
0.62 |
|
Mid-ebb |
IS15 |
F1,37 = 13.3 |
<0.01 |
|
Mid-ebb |
SR10A |
F1,37 = 3.05 |
0.09 |
|
Mid-ebb |
SR8 |
F1,37 = 8.88 |
<0.01 |
|
Mid-ebb |
SR9 |
F1,37 = 0.71 |
0.41 |
|
Mid-flood |
IS12 |
F1,37 = 0.57 |
0.45 |
|
Mid-flood |
IS13 |
F1,37 = 0.22 |
0.64 |
|
Mid-flood |
IS14 |
F1,37 = 2.05 |
0.16 |
|
Mid-flood |
IS15 |
F1,37 = 0.47 |
0.50 |
|
Mid-flood |
SR10A |
F1,37 = 0.01 |
0.93 |
|
Mid-flood |
SR8 |
F1,37 = 2.10 |
0.16 |
|
Mid-flood |
SR9 |
F1,37 = 0.74 |
0.39 |
|
Note: By setting α at 0.05, significant differences (p-value < 0.05) are bold. |
|||
Table 2.14 One-way ANOVA Results for Depth-averaged SS Comparison between Impact and Baseline Periods
|
Tide |
Station |
F ratio |
p-value |
|
Mid-ebb |
IS12 |
F1,37 = 0.39 |
0.53 |
|
Mid-ebb |
IS13 |
F1,37 = 0.04 |
0.84 |
|
Mid-ebb |
IS14 |
F1,37 = 2.17 |
0.15 |
|
Mid-ebb |
IS15 |
F1,37 = 3.17 |
0.08 |
|
Mid-ebb |
SR10A |
F1,37 = 7.36 |
0.01 |
|
Mid-ebb |
SR8 |
F1,37 = 1.42 |
0.24 |
|
Mid-ebb |
SR9 |
F1,37 = 1.12 |
0.30 |
|
Mid-flood |
IS12 |
F1,37 = 0.08 |
0.78 |
|
Mid-flood |
IS13 |
F1,37 = 0.68 |
0.42 |
|
Mid-flood |
IS14 |
F1,37 = 4.58 |
0.04 |
|
Mid-flood |
IS15 |
F1,37 = 1.56 |
0.22 |
|
Mid-flood |
SR10A |
F1,37 = 0.05 |
0.83 |
|
Mid-flood |
SR8 |
F1,37 = 0.11 |
0.75 |
|
Mid-flood |
SR9 |
F1,37 = 0.01 |
0.92 |
|
Note: By setting α at 0.05, significant differences (p-value < 0.05) are bold. |
|||
In addition, linear regression was conducted to examine any relationship between DO / Turbidity / SS levels and time (i.e. number of days after construction works commencement) during this yearly monitoring period at each monitoring station. The method of data interpretation followed the same method as indicated in Section 2.1.3 for TSP monitoring. As shown in Tables 2.15 to 2.17, results of the regression analysis indicated that there was no significant (r2 < 0.60) relationship between DO / Turbidity / SS level and time during this yearly monitoring period. As such, it is considered that there is no apparent trend of increasing or decreasing DO / Turbidity / SS level since commencement of constructions works.
Table 2.15 Linear Regression Result of DO
|
Parameter |
Station |
R2 |
F1,25 |
p-value |
Intercept |
Coefficient of days of construction |
|
Mid-ebb Surface DO |
IS12 |
0.41 |
16.7 |
0.003 |
-28.76 |
0.024 |
|
IS13 |
0.50 |
24.2 |
<0.001 |
-29.1 |
0.024 |
|
|
IS14 |
0.51 |
24.7 |
<0.001 |
-29.5 |
0.024 |
|
|
IS15 |
0.57 |
31.2 |
<0.001 |
-31.7 |
0.026 |
|
|
SR10A |
0.76 |
76.6 |
<0.001 |
-28.77 |
0.024 |
|
|
SR8 |
0.56 |
31.0 |
<0.001 |
-30.77 |
0.025 |
|
|
SR9 |
0.50 |
24.5 |
<0.001 |
-29.61 |
0.024 |
|
|
Parameter |
Station |
R2 |
F1,65 |
p-value |
Intercept |
Coefficient of days of construction |
|
Mid-flood surface DO |
IS12 |
0.232 |
19.4 |
<0.001 |
-23.77 |
0.020 |
|
IS13 |
0.248 |
21.2 |
<0.001 |
-24.35 |
0.021 |
|
|
IS14 |
0.263 |
22.8 |
<0.001 |
-27.44 |
0.023 |
|
|
IS15 |
0.215 |
17.5 |
<0.001 |
-24.20 |
0.021 |
|
|
SR10A |
0.235 |
19.7 |
<0.001 |
-25.20 |
0.021 |
|
|
SR8 |
0.208 |
16.8 |
<0.001 |
-26.04 |
0.022 |
|
|
SR9 |
0.157 |
11.9 |
<0.001 |
-28.21 |
0.023 |
|
|
Parameter |
Station |
R2 |
F1,65 |
p-value |
Intercept |
Coefficient of days of construction |
|
Mid-ebb middle DO |
IS12 |
0.260 |
20.4 |
0.001 |
-29.41 |
0.024 |
|
IS13 |
0.597 |
35.5 |
<0.001 |
-34.07 |
0.027 |
|
|
IS14 |
0.497 |
23.7 |
<0.001 |
-30.50 |
0.025 |
|
|
IS15 |
0.604 |
36.5 |
<0.001 |
-33.41 |
0.027 |
|
|
SR10A |
0.760 |
75.8 |
<0.001 |
-29.55 |
0.024 |
|
|
Parameter |
Station |
R2 |
F1,65 |
p-value |
Intercept |
Coefficient of days of construction |
|
Mid-flood middle DO |
IS12 |
0.407 |
16.4 |
0.004 |
-25.14 |
0.021 |
|
IS13 |
0.387 |
15.1 |
0.005 |
-25.96 |
0.022 |
|
|
IS14 |
0.439 |
18.7 |
0.002 |
-27.45 |
0.023 |
|
|
IS15 |
0.607 |
14.0 |
0.007 |
-25.32 |
0.021 |
|
|
SR10A |
0.703 |
56.9 |
<0.001 |
-25.2 |
0.021 |
|
|
Parameter |
Station |
R2 |
F1,65 |
p-value |
Intercept |
Coefficient of days of construction |
|
Mid-ebb bottom DO |
IS12 |
0.492 |
23.3 |
<0.001 |
-32.47 |
0.026 |
|
IS13 |
0.634 |
41.5 |
<0.001 |
-37.88 |
0.030 |
|
|
IS14 |
0.52 |
25.77 |
<0.001 |
-32.75 |
0.026 |
|
|
IS15 |
0.612 |
37.9 |
<0.001 |
-36.25 |
0.029 |
|
|
SR10A |
0.734 |
66.1 |
<0.001 |
-29.78 |
0.024 |
|
|
SR8 |
0.610 |
37.5 |
<0.001 |
-33.19 |
0.027 |
|
|
SR9 |
0.58 |
33.3 |
<0.001 |
-35.28 |
0.028 |
|
|
Parameter |
Station |
R2 |
F1,65 |
p-value |
Intercept |
Coefficient of days of construction |
|
Mid-flood bottom DO |
IS12 |
0.634 |
16.0 |
0.004 |
-25.79 |
0.022 |
|
IS13 |
0.412 |
16.8 |
0.003 |
-27.27 |
0.023 |
|
|
IS14 |
0.43 |
18.3 |
0.002 |
-27.48 |
0.023 |
|
|
IS15 |
0.395 |
15.6 |
0.004 |
-26.58 |
0.022 |
|
|
SR10A |
0.721 |
61.9 |
<0.001 |
-25.24 |
0.021 |
|
|
SR8 |
0.396 |
15.76 |
0.003 |
-28.39 |
0.023 |
|
|
SR9 |
0.485 |
22.6 |
<0.001 |
-30.24 |
0.025 |
Note:
1. Dependent variable is set as DO (in mg/L) and independent variable is set as number of day of construction works.
2. R2 <0.6 and p-value >0.01 (i.e. showing the regression insignificant) are underlined.
3. By setting α at 0.01, insignificant coefficient is underlined.
Table 2.16 Linear Regression Result of Turbidity
|
Parameter |
Station |
R2 |
F1,65 |
p-value |
Intercept |
Coefficient of days of construction |
|||
|
Mid-ebb depth -average turbidity |
IS12 |
0.063 |
1.62 |
0.184 |
108.7 |
-0.068 |
|||
|
IS13 |
4.84 |
<0.001 |
0.912 |
9.66 |
<0.001 |
||||
|
IS14 |
0.232 |
7.24 |
0.01 |
191.16 |
-0.123 |
||||
|
IS15 |
0.196 |
5.83 |
0.017 |
98.55 |
-0.062 |
||||
|
SR10A |
0.285 |
9.56 |
0.004 |
148.6 |
-0.096 |
||||
|
SR8 |
0.048 |
1.21 |
0.228 |
64.8 |
-0.039 |
||||
|
SR9 |
0.182 |
5.33 |
0.022 |
117.0 |
-0.074 |
||||
|
Parameter |
Station |
R2 |
F1,65 |
p-value |
Intercept |
Coefficient of days of construction |
|||
|
Mid-flood depth -average turbidity |
IS12 |
0.608 |
1.55 |
0.188 |
106.7 |
-0.066 |
|||
|
IS13 |
0.155 |
4.40 |
0.036 |
184.9 |
-0.12 |
||||
|
IS14 |
0.172 |
5.00 |
0.025 |
175.0 |
-0.109 |
||||
|
IS15 |
0.158 |
4.51 |
0.034 |
189.7 |
-0.12 |
||||
|
SR10A |
0.194 |
5.78 |
0.020 |
181.0 |
-0.12 |
||||
|
SR8 |
<0.001 |
0.002 |
0.863 |
10.69 |
-0.002 |
||||
|
SR9 |
0.191 |
5.67 |
0.018 |
127.8 |
-0.081 |
||||
Note:
1. Dependent variable is set as Turbidity (in mg/L) and independent variable is set as number of day of construction works.
2. R2 <0.6 and p-value >0.01 (i.e. showing the regression insignificant) are underlined.
3. By setting α at 0.01, insignificant coefficient is underlined.
Table 2.17 Linear Regression Result of SS
|
Parameter |
Station |
R2 |
F1,65 |
p-value |
Intercept |
Coefficient of days of construction |
|||
|
Mid-ebb depth -average SS |
IS12 |
0.075 |
1.96 |
0.144 |
140.85 |
-0.088 |
|||
|
IS13 |
0.002 |
0.041 |
0.760 |
29.79 |
-0.013 |
||||
|
IS14 |
0.058 |
1.47 |
0.183 |
73.48 |
-0.044 |
||||
|
IS15 |
<0.001 |
0.001 |
0.831 |
9.19 |
-0.001 |
||||
|
SR10A |
0.15 |
4.23 |
0.035 |
96.25 |
-0.060 |
||||
|
SR8 |
0.016 |
0.38 |
0.461 |
48.8 |
-0.027 |
||||
|
SR9 |
0.124 |
3.40 |
0.049 |
70.32 |
-0.042 |
||||
|
Parameter |
Station |
R2 |
F1,65 |
p-value |
Intercept |
Coefficient of days of construction |
|||
|
Mid-flood depth -average SS |
IS12 |
0.098 |
2.61 |
0.097 |
155.2 |
-0.097 |
|||
|
IS13 |
0.135 |
3.73 |
0.051 |
205.0 |
-0.129 |
||||
|
IS14 |
0.168 |
4.85 |
0.028 |
222.7 |
-0.140 |
||||
|
IS15 |
0.147 |
4.15 |
0.040 |
215.3 |
-0.135 |
||||
|
SR10A |
0.059 |
1.49 |
0.201 |
136.5 |
-0.085 |
||||
|
SR8 |
0.154 |
4.38 |
0.037 |
207 |
-0.132 |
||||
|
SR9 |
0.228 |
7.08 |
0.001 |
181.5 |
-0.115 |
||||
Note:
1. Dependent variable is set as Turbidity (in mg/L) and independent variable is set as number of day of construction works.
2. R2 <0.6 and p-value >0.01 (i.e. showing the regression insignificant) are underlined.
3. By setting α at 0.01, insignificant coefficient is underlined.
2.3.1
Monitoring
Requirements
Impact dolphin monitoring is required to be conducted by a qualified dolphin specialist team to evaluate whether there have been any effects on the dolphins. In order to fulfil the EM&A requirements and make good use of available resources, the on-going impact line transect dolphin monitoring data collected by HyD’s Contract No. HY/2011/03 Hong Kong-Zhuhai-Macao Bridge Hong Kong Link Road - Section between Scenic Hill and Hong Kong Boundary Crossing Facilities on the monthly basis are adopted to avoid duplicates of survey effort.
2.3.2
Monitoring
Equipment
Table 2.18 summarize the equipment used for the impact dolphin monitoring.
Table 2.18 Dolphin Monitoring Equipment
|
Equipment |
Model |
|
Global Positioning System (GPS)
Camera
Laser Binoculars Marine Binocular Vessel for Monitoring
|
Garmin 18X-PC Geo One Phottix Nikon D90 300m 2.8D fixed focus Nikon D90 20-300m zoom lens Infinitor LRF 1000 Bushell 7 x 50 marine binocular with compass and reticules 65 foot single engine motor vessel with viewing platform 4.5m above water level |
2.3.3
Monitoring
Parameter, Frequencies & Duration
Dolphin monitoring should cover all transect lines in Northeast Lantau (NEL) and the Northwest Lantau (NWL) survey areas twice per month throughout the entire construction period. The monitoring data should be compatible with, and should be made available for, long-term studies of small cetacean ecology in Hong Kong. In order to provide a suitable long-term dataset for comparison, identical methodology and line transects employed in baseline dolphin monitoring was followed in the impact dolphin monitoring.
2.3.4
Monitoring
Location
The impact dolphin monitoring was carried out in the NEL and NWL along the line transect as depicted in Figure 2.3. The co-ordinates of all transect lines are shown in Table 2.19 below.
Table 2.19 Impact Dolphin Monitoring Line Transect Co-ordinates
|
Line No. |
Easting |
Northing |
Line No. |
Easting |
Northing |
||
|
1 |
Start Point |
804671 |
815456 |
13 |
Start Point |
816506 |
819480 |
|
1 |
End Point |
804671 |
831404 |
13 |
End Point |
816506 |
824859 |
|
2 |
Start Point |
805476 |
820800* |
14 |
Start Point |
817537 |
820220 |
|
2 |
End Point |
805476 |
826654 |
14 |
End Point |
817537 |
824613 |
|
3 |
Start Point |
806464 |
821150* |
15 |
Start Point |
818568 |
820735 |
|
3 |
End Point |
806464 |
822911 |
15 |
End Point |
818568 |
824433 |
|
4 |
Start Point |
807518 |
821500* |
16 |
Start Point |
819532 |
821420 |
|
4 |
End Point |
807518 |
829230 |
16 |
End Point |
819532 |
824209 |
|
5 |
Start Point |
808504 |
821850* |
17 |
Start Point |
820451 |
822125 |
|
5 |
End Point |
808504 |
828602 |
17 |
End Point |
820451 |
823671 |
|
6 |
Start Point |
809490 |
822150* |
18 |
Start Point |
821504 |
822371 |
|
6 |
End Point |
809490 |
825352 |
18 |
End Point |
821504 |
823761 |
|
7 |
Start Point |
810499 |
822000* |
19 |
Start Point |
822513 |
823268 |
|
7 |
End Point |
810499 |
824613 |
19 |
End Point |
822513 |
824321 |
|
8 |
Start Point |
811508 |
821123 |
20 |
Start Point |
823477 |
823402 |
|
8 |
End Point |
811508 |
824254 |
20 |
End Point |
823477 |
824613 |
|
9 |
Start Point |
812516 |
821303 |
21 |
Start Point |
805476 |
827081 |
|
9 |
End Point |
812516 |
824254 |
21 |
End Point |
805476 |
830562 |
|
10 |
Start Point |
813525 |
821176 |
22 |
Start Point |
806464 |
824033 |
|
10 |
End Point |
813525 |
824657 |
22 |
End Point |
806464 |
829598 |
|
11 |
Start Point |
814556 |
818853 |
23 |
Start Point |
814559 |
821739 |
|
11 |
End Point |
814556 |
820992 |
23 |
End Point |
814559 |
824768 |
|
12 |
Start Point |
815542 |
818807 |
24* |
Start Point |
805476* |
815900* |
|
12 |
End Point |
815542 |
824882 |
24* |
End Point |
805476* |
819100* |
Remarks: The coordinates of several starting and ending points have been revised since August 2017 due to the presence of a work zone to the north of the airport platform with intense construction activities in association with the construction of the third runway expansion for the Hong Kong International Airport. Co-ordinates in red and marked with asterisk are revised co-ordinates of transect line.
2.3.5
Action & Limit Levels
The Action and Limit levels of dolphin impact monitoring are shown in Appendix C. The Event and Action plan is presented in Appendix G.
2.3.6
Results
& Observations
A total of 3,152.08 km of survey effort was collected, with 93.6% of the total survey effort being conducted under favourable weather conditions (ie Beaufort Sea State 3 or below with good visibility) in this reporting year. Amongst the two areas, 1,160.48 km and 1,991.60 km of survey effort were collected from NEL and NWL survey areas, respectively. The total survey effort conducted on primary and secondary lines were 2,300.78 km and 851.30 km, respectively. The survey efforts are summarized in Appendix F.
A total of 42 groups of 131 Chinese White Dolphin sightings were recorded during the 24 sets of surveys in this reporting year. All except two (2) sightings were made during on-effort search. Thirty-three (33) on-effort sightings were made on primary lines, while seven (7) other on-effort sightings were made on secondary lines. During this reporting year, all dolphin groups were sighted in NWL, while none of them were sighted in NEL.
Dolphin sighting distribution of the present impact phase monitoring period (November 2017 to October 2018 was compared to the ones during the baseline phase (February 2011 to January 2012), transitional phase (November 2012 to October 2013) and the first, second, third and fourth years of impact phase (November 2013 to October 2014, November 2014 to October 2015, November 2015 to October 2016 and November 2017 to October 2018 respectively). As TMCLKL construction works commenced in November 2013, a 12-month period between baseline phase and impact phase is defined as transitional phase.
During the present 12-month impact phase monitoring period, the average daily encounter rates of Chinese White Dolphins were deduced in NEL and NWL survey areas, and compared to the ones deduced from the baseline and transitional phases as shown in Table 2.20.
Table 2.20 Average Daily Dolphin Encounter Rates
|
|
Encounter rate (STG) (no. of on-effort dolphin sightings per 100 km of survey effort) |
Encounter rate (ANI) (no. of dolphins from all on-effort sightings per 100 km of survey effort) |
||
|
Northeast Lantau |
Northwest Lantau |
Northeast Lantau |
Northwest Lantau |
|
|
Impact Phase (2017-18) |
0.00 |
2.68 ± 3.04 |
0.00 |
9.02 ± 14.63 |
|
Impact Phase (2016-17) |
0.00 |
2.35 ± 2.62 |
0.00 |
8.57 ± 11.05 |
|
Impact Phase (2015-16) |
0.00 |
2.10 ± 1.83 |
0.00 |
8.54 ± 8.53 |
|
Impact Phase (2014-15) |
0.11 ± 0.54 |
2.54 ± 2.49 |
0.11 ± 0.54 |
11.64 ± 14.04 |
|
Impact Phase (2013-14) |
0.22 ± 0.74 |
6.93 ± 4.08 |
0.76 ± 2.59 |
26.31 ± 17.56 |
|
Transitional Phase (2012-13) |
1.70 ± 2.26 |
7.68 ± 4.36 |
4.75 ± 7.61 |
27.51 ± 18.06 |
|
Baseline Phase (2011-12) |
6.05 ± 5.04 |
7.75 ± 5.69 |
19.91 ± 21.30 |
29.57 ± 26.96 |
Note: Comparison of average daily dolphin encounter rates from the first, second, third, fourth and fifth years of impact phase (November 2013 to October 2014, November 2014 to October 2015, November 2015 to October 2016, November 2016 to October 2017, and November 2017 to October 2018 respectively), transitional phase (November 2012 – October 2013) and baseline phase monitoring periods (February 2011 – January 2012). ± denotes the standard deviation of the value.
Group size of Chinese White Dolphins ranged from one to twelve (1-12) individuals per group in North Lantau region during November 2017 - October 2018. The average dolphin group sizes from the 12-month impact phase monitoring period were compared with the ones deduced from baseline and transitional phases, as shown in Table 2.21.
Table 2.21 Comparison of Average Dolphin Group Sizes from Impact Monitoring Period and Baseline Monitoring Period
|
|
Average Dolphin Group Size |
||
|
Overall |
Northeast Lantau |
Northwest Lantau |
|
|
Impact Phase (2017-18) |
3.12 ± 2.86 (n = 42) |
0.00 |
3.12 ± 2.86 (n = 42) |
|
Impact Phase (2016-17) |
3.51 ± 2.68 (n = 43) |
0.00 |
3.51 ± 2.68 (n = 43) |
|
Impact Phase (2015-16) |
3.73 ± 3.14 (n = 45) |
1.00 (n = 1) |
3.80 ± 3.14 (n = 44) |
|
Impact Phase (2014-15) |
4.24 ± 3.15 (n = 54) |
1.00 (n = 1) |
4.30 ± 3.15 (n = 53) |
|
Impact Phase (2013-14) |
3.76 ± 2.57 (n = 136) |
5.00 ± 2.71 (n = 4) |
3.73 ± 2.57 (n = 132) |
|
Transitional Phase (2012-13) |
3.37 ± 2.98 (n = 186) |
2.64 ± 2.38 (n = 22) |
3.47 ± 3.05 (n = 164) |
|
Baseline Phase (2011-12) |
3.32 ± 2.86 (n = 288) |
2.80 ± 2.35 (n = 79) |
3.52 ± 3.01 (n = 209) |
Note: Comparison of average dolphin group sizes from the first, second, third, fourth and fifth years of impact phase (November 2013 to October 2014, November 2014 to October 2015, November 2015 to October 2016, November 2016 to October 2017, and November 2017 to October 2018r espectively), transitional phase (November 2012 – October 2013) and baseline phase monitoring periods (February 2011 – January 2012). (± denotes the standard deviation of the average value)
Whilst two (2) Action Level and three (3) Limit Level exceedances were observed for the quarterly dolphin monitoring data between November 2017 and October 2018. In this reporting period, no unacceptable impact from the activities of this Contract on Chinese White Dolphins was noticeable from the general observations. It is essential to continue monitoring the dolphin usage in North Lantau region for the rest of the impact phase monitoring period.
2.3.7
Implementation
of Marine Mammal Exclusion Zone
Daily marine mammal exclusion zone was in effect during the period of dredging, reclamation or marine sheet piling works in open waters under this Contract. Passive Acoustic Monitoring (PAM) was also implemented for the detection of marine mammal when dredging, reclamation or marine sheet piling works were carried out outside the daylight hours under this Contract. No sighting of the Indo-Pacific humpback dolphin Sousa chinensis (i.e. Chinese White Dolphin) was recorded in the reporting period during the exclusion zone monitoring.
Site inspections were carried out on a weekly basis to monitor the implementation of proper environmental pollution control and mitigation measures under the Contract. Fifty-three (53) site inspections were carried out in the reporting period. Key observations were summarized in the Forty-ninth to Sixtieth Monthly EM&A Reports.
The Contractor was registered as chemical waste producer under the Contract. Sufficient numbers of receptacles were available for general refuse collection and sorting.
Wastes generated during this reporting period include mainly construction wastes (inert and non-inert) and recyclable materials. Reference has been made to the waste flow table prepared by the Contractor (Appendix I). The quantities of different types of wastes are summarized in Table 2.22.
Table 2.22 Quantities of Different Waste Generated in the Reporting Period
|
Month/Year |
Inert Construction Waste (a) (tonnes) |
Inert Construction Waste Re-used (tonnes) |
Non-inert Construction Waste (b) (tonnes) |
Recyclable Materials (c) (kg) |
Chemical Wastes (kg) |
Marine Sediment (m3) |
|
|
Category L |
Category M |
||||||
|
November 2017 |
3,259 |
0 |
345 |
343,470 |
3,800 |
0 |
5,836 |
|
December 2017 |
3,574 |
0 |
121 |
0 |
0 |
0 |
3942 |
|
January 2018 |
7,165 |
0 |
272 |
241,700 |
2,800 |
0 |
11,357 |
|
February 2018 |
1,762 |
0 |
258 |
257,140 |
0 |
0 |
2,840 |
|
March 2018 |
66,457 |
62,274 |
459 |
229,360 |
2,000 |
2,000 |
0 |
|
April 2018 |
123,942 |
50,648 |
281 |
195,550 |
8,600 |
8,600 |
0 |
|
May 2018 |
127,964 |
62,822 |
686 |
93,010 |
10,400 |
0 |
0 |
|
June 2018 |
102,987 |
55,385 |
408 |
1,060 |
0 |
0 |
0 |
|
July 2018 |
43,768 |
0 |
768 |
770 |
0 |
0 |
0 |
|
August 2018 |
57,809 |
40,722 |
749 |
574,260 |
0 |
200 |
0 |
|
September 2018 |
39,763 |
11,276 |
445 |
0 |
0 |
0 |
7,703 |
|
October 2018 |
108,689 |
80,347 |
437 |
0 |
0 |
5,343 |
9,073 |
|
Total |
706,957 |
383,265 |
5,229 |
3,953,742 |
1,508,070 |
16,143 |
40,751 |
The Contractor was advised to properly maintain on site C&D materials and waste collection, sorting and recording system, dispose of C&D materials and wastes at designated ground and maximize reuse/ recycle of C&D materials and wastes. The Contractor was also reminded to properly maintain the site tidiness and dispose of the wastes accumulated on site regularly and properly.
For chemical waste containers, the Contractor was reminded to treat properly and store temporarily in designated chemical waste storage area on site in accordance with the Code of Practice on the Packaging, Labelling and Storage of Chemical Wastes.
2.6
Environmental
Licenses and Permits
The status of environmental licensing and permit is summarized in Table 2.23 below.
Table 2.23 Summary of Environmental Licensing and Permit Status
|
License/ Permit |
License or Permit No. |
Date of Issue |
Date of Expiry |
License/ Permit Holder |
Remarks |
||||||
|
|
Environmental Permit |
EP-354/2009/D |
13 March 2015 |
Throughout the Contract |
HyD |
Application for VEP on 3 March 2015 to supersede EP-354/2009/C |
|||||
|
|
Construction Dust Notification
|
363510
|
19 August 2013
|
Throughout the Contract |
DBJV |
Northern Landfall |
|||||
|
|
Construction Dust Notification
|
403620 |
10 June 2016 |
Throughout the Contract |
DBJV |
Southern Landfall |
|||||
|
|
Chemical Waste Registration |
5213-422-D2516-02 |
18 January 2017 |
Throughout the Contract |
DBJV |
Northern Landfall
|
|||||
|
|
Chemical Waste Registration |
5213-951-D2591-01 |
25 May 2016 |
Throughout the Contract |
DBJV |
Southern Landfall |
|||||
|
|
Construction Waste Disposal Account |
7018108 |
28 August 2013 |
Throughout the Contract |
DBJV |
Waste disposal in Contract No. HY/2012/08 |
|||||
|
|
Construction Waste Disposal Account |
7021715 |
17 July 2018 |
17 October 2018 |
DBJV |
Vessel Disposal |
|||||
|
|
Construction Waste Disposal Account |
7021715 |
18 October 2018 |
17 January 2019 |
DBJV |
Vessel Disposal |
|||||
|
|
Waste Water Discharge License |
WT00017707-2013 |
18 November 2013 |
30 November 2018 |
DBJV |
For site WA18 |
|||||
|
|
Waste Water Discharge License |
WT00019248-2014 |
5 June 2014 |
30 June 2019 |
DBJV |
For site Portion N6 and Reclamation Area E |
|||||
|
|
Waste Water Discharge License |
WT00025944-2016 |
15 December 2016 |
31 December 2021 |
DBJV |
Southern Landfall |
|||||
|
|
Marine Dumping Permit |
EP/MD/18-087 |
21 November 2017 |
20 December 2017 |
DBJV |
Type 1 (Dedicated site) and Type 2 (Confined Marine Disposal) |
|||||
|
|
Marine Dumping Permit |
EP/MD/18-118 |
21 January 2018 |
20 February 2018 |
DBJV |
Type 1 (Dedicated site) and Type 2 (Confined Marine Disposal) |
|||||
|
|
Marine Dumping Permit |
EP/MD/18-098 |
21 December 2017 |
20 January 2018 |
DBJV |
Type 1 (Dedicated site) and Type 2 (Confined Marine Disposal) |
|||||
|
|
Marine Dumping Permit |
EP/MD/19-001 |
24 April 2018 |
23 May 2018 |
DBJV |
Type 1 (Dedicated site) and Type 2 (Confined Marine Disposal) |
|||||
|
|
Marine Dumping Permit |
EP/MD/18-133 |
22 March 2018 |
21 April 2018 |
DBJV |
Type 1 (Dedicated site) and Type 2 (Confined Marine Disposal) |
|||||
|
|
Marine Dumping Permit |
EP/MD/18-125 |
21 February 2018 |
20 March 2018 |
DBJV |
Type 1 (Dedicated site) and Type 2 (Confined Marine Disposal) |
|||||
|
|
Marine Dumping Permit |
EP/MD/19-041 |
5 October 2018 |
4 November 2018 |
DBJV |
Type 1 (Dedicated site) and Type 2 (Confined Marine Disposal) |
|||||
|
|
Marine Dumping Permit |
EP/MD/19-009 |
28 June 2018 |
27 July 2018 |
DBJV |
Type 1 (Dedicated site) and Type 2 (Confined Marine Disposal) |
|||||
|
|
Marine Dumping Permit |
EP/MD/19-001 |
28 May 2018 |
27 June 2018 |
DBJV |
Type 1 (Dedicated site) and Type 2 (Confined Marine Disposal) |
|||||
|
|
Marine Dumping Permit |
EP/MD/19-024 |
28 August 2018 |
27 September 2018 |
DBJV |
Type 1 (Dedicated site) and Type 2 (Confined Marine Disposal) |
|||||
|
|
Marine Dumping Permit |
EP/MD/19-034 |
28 September 2018 |
27 October 2018 |
DBJV |
SVS |
|||||
|
|
Marine Dumping Permit |
EP/MD/19-063 |
19 November 2018 |
18 May 2019 |
DBJV |
Type 1 (Open Sea Disposal) |
|||||
|
|
Marine Dumping Permit |
EP/MD/19-057 |
5 November 2018 |
4 December 2018 |
DBJV |
Type 1 (Dedicated site) and Type 2 (Confined Marine Disposal) |
|||||
|
|
Marine Dumping Permit |
EP/MD/19-015 |
5 September 2018 |
4 March 2019 |
DBJV |
Catepillar Area |
|||||
|
|
Construction Noise Permit |
GW-RW0538-17 |
16 April 2018 |
15 October 2018 |
DBJV |
For Urmston Road in front of Pillar Point |
|||||
|
|
Construction Noise Permit |
PP-RS0026-17 |
3 April 2017 |
31 July 2018 |
DBJV |
Southern Landfall (Percussive Piling) |
|||||
|
|
Construction Noise Permit |
GW-RW0538-17 |
16 October 2017 |
15 April 2018 |
DBJV |
For Urmston Road in front of Pillar Point |
|||||
|
|
Construction Noise Permit |
GW-RW0641-17 |
16 December 2017 |
6 December 2018 |
DBJV |
WA23 @ Tsing Yi |
|||||
|
|
Construction Noise Permit |
PP-RS0026-17 |
1 December 2017 |
29 March 2018 |
DBJV |
Southern Landfall (Percussive Piling) |
|||||
|
|
Construction Noise Permit |
GW-RW0344-18 |
20 August 2018 |
19 February 2019 |
DBJV |
WA23 @ Tsing Yi |
|||||
|
|
Construction Noise Permit |
GW-RS0878-17 |
11 October 2017 |
2 April 2018 |
DBJV |
Southern Landfall |
|||||
|
|
Construction Noise Permit |
GW-RW0279-17 |
13 June 2017 |
12 December 2017 |
DBJV |
WA23 @ Tsing Yi |
|||||
|
|
Construction Noise Permit |
PP-RS0019-17 |
31 August 2017 |
30 November 2017 |
DBJV |
Southern Landfall (Percussive Piling) |
|||||
|
|
Construction Noise Permit |
GW-RW0060-18 |
20 February 2018 |
19 August 2018 |
DBJV |
WA23 @ Tsing Yi |
|||||
|
|
Construction Noise Permit |
GW-RS0027-18 |
22 January 2018 |
14 July 2018 |
DBJV |
Southern Landfall |
|||||
|
|
Construction Noise Permit |
GW-RS0598-18 |
15 July 2018 |
14 January 2019 |
DBJV |
Southern Landfall |
|||||
|
|
Construction Noise Permit |
GW-RW0406-18 |
16 October 2018 |
15 April 2019 |
DBJV |
Urmston Road in front of Pillar Point |
|||||
|
|
Construction Noise Permit |
GW-RS0966-18 |
26 October 2018 |
14 April 2019 |
DBJV |
Southern Landfall |
|||||
|
Notes: |
|
|
|
|
|
||||||
|
HyD = Highways Department DBJV = Dragages – Bouygues Joint Venture VEP = Variation of Environmental Permit |
|||||||||||
2.7
Implementation
Status of Environmental Mitigation Measures
In response to the EM&A site audit findings mentioned in Section 2.4 of this report, the Contractor has carried out the corrective actions.
A summary of the Implementation Schedule of Environmental Mitigation Measures (EMIS) is presented in Appendix B. The necessary mitigation measures relevant to this Contract were implemented properly.
2.8
Summary
of Exceedances of the Environmental Quality Performance Limit
In this reporting period, a total of 120 air quality monitoring events were undertaken in which Twenty-nine (29) Action Level exceedances of 1-hour TSP, two (2) Limit Level exceedances of 1-hour TSP, two (2) Action Level exceedances of 24-hour TSP and three (3) Limit Level exceedances of 24-hour TSP were recorded. (Table 2.24).
Table 2.24 Summary of Exceedances for Air Quality Impact Monitoring in this Reporting Year
|
Station |
Exceedance Level |
Number of Exceedances |
|
|
1-hr TSP |
24-hr TSP |
||
|
AQMS1 |
Action Level |
0 |
0 |
|
Limit Level |
0 |
0 |
|
|
ASR1 |
Action Level |
13 |
1 |
|
Limit Level |
1 |
1 |
|
|
ASR5 |
Action Level |
14 |
0 |
|
Limit Level |
0 |
2 |
|
|
AQMS2/ASR6 |
Action Level |
0 |
0 |
|
Limit Level |
0 |
0 |
|
|
ASR10 |
Action Level |
2 |
1 |
|
Limit Level |
1 |
0 |
|
|
Total number of Action level Exceedances: 29 2 |
|||
|
Total number of Limit level Exceedances: 2 3 |
|||
For marine water quality impact monitoring, a total of 26 monitoring events were undertaken in which fourteen (14) Action Level exceedances were recorded. (Table 2.25).
Table 2.25 Summary of Exceedances for Marine Water Quality Impact Monitoring in this Reporting Period
|
Station |
Exceedance Level (a) |
DO (Surface and Middle) |
DO (Bottom) |
Turbidity (depth-averaged) |
SS (depth-averaged) |
||||
|
Mid-ebb |
Mid-flood |
Mid-ebb |
Mid-flood |
Mid-ebb |
Mid-flood |
Mid-ebb |
Mid-flood |
||
|
CS4 |
AL |
- |
- |
- |
- |
- |
- |
- |
- |
|
LL |
- |
- |
- |
- |
- |
- |
- |
- |
|
|
CS6 |
AL |
- |
- |
- |
- |
- |
- |
- |
- |
|
LL |
- |
- |
- |
- |
- |
- |
- |
- |
|
|
IS12 |
AL |
- |
- |
- |
- |
- |
- |
1 |
1 |
|
LL |
- |
- |
- |
- |
- |
- |
- |
- |
|
|
IS13 |
AL |
- |
- |
- |
- |
- |
- |
1 |
1 |
|
LL |
- |
- |
- |
- |
- |
- |
- |
- |
|
|
IS14 |
AL |
- |
- |
- |
- |
- |
- |
- |
2 |
|
LL |
- |
- |
- |
- |
- |
- |
- |
- |
|
|
IS15 |
AL |
- |
- |
- |
- |
- |
- |
- |
3 |
|
LL |
- |
- |
- |
- |
- |
- |
- |
- |
|
|
SR8 |
AL |
- |
- |
- |
- |
- |
- |
- |
2 |
|
LL |
- |
- |
- |
- |
- |
- |
- |
- |
|
|
SR9 |
AL |
- |
- |
- |
- |
- |
- |
- |
1 |
|
LL |
- |
- |
- |
- |
- |
- |
- |
- |
|
|
SR10A |
AL |
- |
- |
- |
- |
- |
- |
- |
2 |
|
LL |
- |
- |
- |
- |
- |
- |
- |
- |
|
|
Total AL Exceedances: |
0 |
0 |
0 |
0 |
0 |
0 |
2 |
12 |
|
|
Total LL Exceedances: |
0 |
0 |
0 |
0 |
0 |
0 |
0 |
0 |
|
|
Notes: |
|||||||||
|
(a) AL = Action Level; LL = Limit Level |
|||||||||
There were a total of two (2) Action Level and three (3) Limit Levels exceedances for impact dolphin monitoring in the reporting period. No unacceptable impact from the construction activities of the TM-CLKL Northern Connection Sub-sea Tunnel Section on Chinese White Dolphins was noticeable from general observations during the dolphin monitoring in this reporting period. Detailed investigation findings are presented in the Sixteenth to Nineteenth Quarterly EM&A Report.
Cumulative statistics are provided in Appendix H.
2.9
Summary
of Complaints, Notification of Summons and Successful Prosecutions
The Environmental Complaint Handling Procedure is provided in Figure 2.4.
No non-compliance event was recorded during the reporting period.
One (1) environmental complaint case was received in this reporting period. The investigation reports were submitted to ENPO and reported in the subsequent EM&A reports.
No environmental summons was received in this reporting period.
Statistics on complaints, notifications of summons and successful prosecutions are summarized in Appendix H.
2.10
Comparison
of EM&A Data with EIA Predictions
Findings of the EM&A activities undertaken during the period from 1 November 2017 to 31 October 2018 were compared with the relevant EIA predictions where appropriate to provide a review of the validity of the EIA predictions and identify potential shortcomings in the EIA recommendations.
2.10.1
Air
Quality
Based on the findings presented in TM-CLKL EIA study, the major sources of dust nuisance arising from the Northern Connection are related to excavation, wind erosion from reclaimed areas, open sites and stockpiling areas. Therefore, during these construction activities, the TSP monitoring frequency will be increased at all air quality monitoring stations such that any deteriorating air quality can be readily detected and timely action taken to rectify the situation. Comparison of EIA prediction, average baseline monitoring and average impact monitoring results of TSP is presented in Table 2.26.
Table 2.26 Comparison of EIA prediction and EM&A Results on Air Quality
|
Station |
EIA Predicted Maximum |
Maximum Impact Monitoring |
Average Impact Monitoring |
Maximum Baseline Monitoring |
Average Baseline Monitoring |
|
ASR1 (1-hour) |
195 |
584 |
138 |
182 |
125 |
|
ASR1 (24-hour) |
148 |
328 |
89 |
173 |
128 |
|
ASR5 (1-hour) |
235 |
455 |
167 |
211 |
138 |
|
ASR5 (24-hour) |
133 |
279 |
100 |
249 |
167 |
|
AQMS1 (1-hour) |
N/A |
324 |
99 |
196 |
131 |
|
AQMS1 (24-hour) |
N/A |
207 |
64 |
211 |
127 |
|
AQMS2/ASR6 (1-hour) |
226 |
335 |
123 |
226 |
135 |
|
AQMS2/ASR6 (24-hour) |
153 |
178 |
77 |
221 |
166 |
|
ASR10 (1-hour) |
189 |
816 |
87 |
215 |
134 |
|
ASR10 (24-hour) |
112 |
250 |
59 |
181 |
129 |
As shown in Table 2.26, maximum 1-hour TSP at ASR1, ASR5, ASR6 and ASR10 and 24-hour TSP impact monitoring levels at ASR1, ASR5, ASR 6 and ASR10 were higher than their corresponding EIA predicted maximum levels. Occasional exceedances were recorded at these stations during impact monitoring period. However, they were not project-related upon investigation. It also appeared that the construction activities of the Contract did not cause significant impact on air quality with similar average TSP levels between the baseline and impact monitoring. The EIA has concluded that no adverse residual construction dust impacts will occur after implementation of mitigation measures. Thus, the monitoring results are considered to be in line with the EIA prediction.
2.10.2
Water
Quality
As identified in the EIA Report, key water quality issues during construction phase may be caused by dredging and filling works for the reclamation of the Project. Thus, marine water quality monitoring should be carried out during the construction phase to ensure that any unacceptable increase in suspended solids / turbidity or unacceptable decrease in dissolved oxygen due to dredging and filling activities could be readily detected and timely action could be taken to rectify the situation.
According to the EIA prediction, no SS exceedance is anticipated from this Project at the water sensitive receivers in the vicinity of the Contract works area (WSR 12, WSR 13 and WSR 47a). Occasional exceedances were recorded during impact monitoring period. The annual mean values of depth-averaged SS recorded in this reporting period were compared with the relevant concerned mean values, which were defined as 30% above baseline levels. Results showed that the annual mean values of depth-averaged SS at all monitoring stations except IS14 were well below the concerned mean values (Table 2.27), thus the impact monitoring results are considered to in line with the EIA prediction.
DO levels from surface, mid-depth and bottom waters were generally similar amongst Control, Impact stations and Sensitive Receivers, and DO levels were variable throughout the reporting period which represented natural background fluctuation in water quality. Similar to DO levels, turbidity and SS levels were generally comparable amongst Control, Impact stations and Sensitive Receivers and variable throughout the monitoring period. High levels of turbidity and SS were occasionally recorded during both mid-ebb and mid-flood tides. Such fluctuations were also observed during baseline monitoring and are considered to be sporadic events and characteristic of water quality in this area of Hong Kong.
The annual means of DO levels during impact period were higher than the means of DO levels measured during baseline period. The annual means of depth-averaged SS and Turbidity during impact period were lower than the means of depth-averaged SS and Turbidity measured during baseline period. One way Analysis of Variance (ANOVA) was conducted to test for the differences between the baseline and impact monitoring data of Dissolved Oxygen, Turbidity and SS at the designated water quality monitoring locations. The detailed graphical and statistical results, as presented in Section 2.2.3 and Appendix E respectively, show that depth-averaged SS and Turbidity levels were lower during impact period than baseline period whilst DO levels were higher during impact period than baseline period. No deterioration trend on water quality was detected in the reporting period when comparing to baseline data. Thus, the impact monitoring results are considered to in line with the EIA prediction.
Table 2.27 Comparison between Annual Mean and Ambient Mean Values of Depth-averaged Suspended Solids (mg/L)
|
Station |
Baseline Mean |
Ambient Mean (a) |
Annual Mean (November 2017 to October 2018) |
|||
|
Mid-ebb |
Mid-flood |
Mid-ebb |
Mid-flood |
Mid-ebb |
Mid-flood |
|
|
CS4 |
10.2 |
9.0 |
13.3 |
11.7 |
7.8 |
10.5 |
|
CS6 |
10.9 |
11.7 |
14.1 |
15.2 |
6.7 |
8.8 |
|
IS12 |
9.2 |
9.5 |
12.0 |
12.3 |
10.3 |
10.0 |
|
IS13 |
10.0 |
10.5 |
13.0 |
13.7 |
10.3 |
12.2 |
|
IS14 |
10.4 |
9.7 |
13.5 |
12.6 |
8.6 |
13.7 |
|
IS15 |
9.6 |
11.0 |
12.5 |
14.2 |
7.7 |
13.4 |
|
SR10A |
10.3 |
10.2 |
13.3 |
13.3 |
7.4 |
9.8 |
|
SR8 |
10.1 |
11.3 |
13.1 |
14.7 |
8.5 |
10.7 |
|
SR9 |
8.8 |
9.9 |
11.4 |
12.8 |
7.8 |
10.0 |
|
Grand Total |
10.0 |
10.3 |
13.0 |
13.4 |
8.3 |
11.0 |
|
Notes: |
||||||
|
(a) Ambient mean value is defined as a 30% increase of the baseline mean value |
||||||
2.10.3
Marine
Ecology
Impact monitoring on marine ecology was undertaken during the monitoring period. According to the baseline results in the Appendix F of the approved EIA Report, the dolphin groups were largely sighted near Lung Kwu Chau and the waters between Lung Kwu Chau and Black Points and infrequently along the alignment of this Contract. Two-way ANOVAs with repeated measures were conducted to compare results of average encounter rate of sightings (STG) and average encounter rate of dolphins (ANI) between baseline and impact periods. The STG and ANI in impact monitoring period were lower than that before the commencement of this Contract (see Section 2.3.6) and the distribution pattern was also different between the impact monitoring period and before the commencement (i.e. transition period in 2012 – 2013) of this Contract. In addition, the habitat use pattern between impact monitoring in this reporting period and before the commencement of this Contract is different. During the present impact phase monitoring period in 2017-18, the most heavily utilized habitats by Chinese White Dolphins were only found on both northwestern end of the North Lantau region, mainly to the north and east of Lung Kwu Chau. Dolphin usage of NWL waters declined during the present and previous phase monitoring periods. The monitoring results in this reporting period are considered to be in line with the EIA predictions, and the review of monitoring data suggested that no unacceptable impacts was noted from the marine dredging and reclamation activities under this Contract. It is essential to monitor the dolphin usage in North Lantau region for the rest of impact monitoring period to keep track on the trend of dolphin ranging pattern.
2.10.4
Waste
Management
For wastes generated from the construction activities including C&D materials (inert and non-inert), chemical wastes, recyclable materials and marine sediments (both categories L and M), the types of wastes generated were in line with the EIA predictions. The wastes were disposed of in accordance with the recommendations of the EIA.
2.11
Summary
of Monitoring Methodology and Effectiveness
The EM&A monitoring programme has been reviewed and was considered effective and adequate to cater for the nature of works in progress. No change to the monitoring programme was considered necessary.
The EM&A programme will be evaluated as appropriate in the next reporting period and improvements in the EM&A programme will be recommended if deemed necessary.
2.12
Summary
of Mitigation Measures
The mitigation measures stipulated in the Updated EM&A Manual were undertaken by the Contractor in the reporting period. The mitigation measures were reviewed and considered effective. No addition or change on mitigation measures was considered necessary.
Weekly joint environmental site inspections have been conducted in the reporting period to assess the effectiveness of the environmental controls established by the Contractor and the implementation of the environmental mitigation measures recommended in the EIA Report. Findings of the site inspections confirmed that the environmental mitigation measures recommended in the EIA Report were properly implemented by the Contractor, and the recommended mitigation measures have been working effectively. There was no non-compliance recorded during the site inspections and environmental performance complied with environmental requirements.
The requirements for site inspections and audits have been reviewed and were considered as adequate. No change to the requirements was considered to be necessary.
The recommended environmental mitigation measures are also considered to be effective and efficient in reducing the potential environmental impacts associated with the construction phase of the Project. No change was thus considered necessary.
Construction phase air quality monitoring was conducted during this reporting period when land-based construction works were undertaken. Twenty-nine (29) Action Level exceedances of 1-hour TSP, two (2) Limit Level exceedances of 1-hour TSP, two (2) Action Level exceedances of 24-hour TSP and three (3) Limit Level exceedances of 24-hour TSP were recorded in the air quality monitoring of this reporting period.
The monitoring programme has been reviewed and was considered to be adequate to cater for the nature of works. No change to the requirements was considered to be necessary.
3.3
Marine Water Quality Monitoring
Fourteen (14) Action Level exceedances were recorded from the water quality monitoring in this reporting period. Marine water quality monitoring was suspended from 31 December 2017 after the completion of Seawall Enhancement Works.
The monitoring programme has been reviewed and was considered to be adequate to cater for the nature of works. No change to the requirements was considered to be necessary.
3.4
Waste Management
The waste inspection and audit programme has been implemented during this reporting period. Wastes generated from construction activities have been managed in accordance with the recommendations in the EIA Report, the EM&A Manual, the WMP and other relevant legislative requirements.
The requirements for construction waste management have been reviewed and were considered as adequate. No change to the requirements was considered to be necessary.
Daily marine mammal exclusion zone was in effect during the period of dredging, reclamation or marine sheet piling works in open waters under this Contract. Passive Acoustic Monitoring (PAM) was also implemented for the detection of marine mammal when dredging, reclamation or marine sheet piling works were carried out outside the daylight hours under this Contract. No sighting of the Indo-Pacific humpback dolphin Sousa chinensis (i.e. Chinese White Dolphin) was recorded in the reporting period during the exclusion zone monitoring.
3.6
Summary of Recommendations
Findings of the EM&A programme indicate that the recommended mitigation measures have been properly implemented and working effectively. The EM&A programme has been reviewed and was considered as adequate and effective. No change to the EM&A programme was considered to be necessary.
The EM&A programme will be evaluated as appropriate in the next reporting period and improvements in the EM&A programme will be recommended if deemed necessary.
This Fifth Annual EM&A Report presents the findings of the EM&A activities undertaken during the period from 1 November 2017 to 31 October 2018, in accordance with the Updated EM&A Manual and the requirements of EP-354/2009/D.
Air quality (including 1-hour TSP and 24-hour TSP) and dolphin monitoring were carried out in the reporting period. Twenty-nine (29) Action Level exceedances of 1-hour TSP, two (2) Limit Level exceedances of 1-hour TSP, two (2) Action Level exceedances of 24-hour TSP and three (3) Limit Level exceedances of 24-hour TSP were recorded in the air quality monitoring of this reporting period. The Contractor was reminded to ensure that all dust mitigation measures are provided at the construction sites.
Fourteen (14) Action Level exceedances were recorded from the water quality monitoring in this reporting period.
A total of 42 groups of 131 Chinese White Dolphin sightings were recorded during the 24 sets of surveys in this reporting year. Whilst two Action Level and three (3) Limit Level exceedances were recorded for four (4) sets of quarterly dolphin monitoring data between November 2017 and October 2018, no unacceptable impact from the construction activities of the TM-CLKL Northern Connection Sub-sea Tunnel Section on Chinese White Dolphins was noticeable from general observations during dolphin monitoring in this reporting period. It is essential to monitor the dolphin usage in North Lantau region for the rest of impact monitoring period to keep track on the trend of dolphin ranging pattern.
Fifty-three (53) weekly environmental site inspections were carried out in the reporting period. Recommendations on remedial actions provided for the deficiencies identified during the site audits were properly implemented by the Contractor. No non-compliance event was recorded during the reporting period.
One (1) environmental complaint case was received in this reporting period. The investigation reports were submitted to ENPO and reported in the subsequent EM&A reports.
No environmental summons was received in this reporting period.
The review of monitoring data suggested that the construction works under this Contract have proceeded in an environmentally acceptable manner in this reporting period.
The monitoring programme has been reviewed and was considered as adequate to cater for the nature of works in progress. Change to the monitoring programme was thus not recommended at this stage. The ET will keep track on the construction works to confirm compliance of environmental requirements and the proper implementation of all necessary mitigation measures.