Contract No. HY/2010/02 – Hong Kong-Zhuhai-Macao Bridge
Hong Kong Boundary Crossing Facilities – Reclamation Work (here below, known as
“the Project”) mainly comprises reclamation at the northeast of
the Hong Kong International Airport of
an area of
about 130-hectare for
the construction of an artificial island for the development of the Hong
Kong Boundary Crossing Facilities (HKBCF), and about 19-hectare for the
southern landfall of the Tuen Mun - Chek Lap Kok Link (TMCLKL). It is a
designated project and is governed by the current permits for the Project, i.e.
the amended Environmental Permits (EPs) issued on 24 April 2013 (EP-353/2009/F) and 28 January 2014 (EP-354/2009/B) (for TMCLKL
Southern Landfall Reclamation only).
Ove Arup & Partners Hong Kong Limited (Arup)
was appointed by Highways Department (HyD) as the consultants for the design
and construction assignment for the Project’s reclamation works (i.e. the
Engineer for the Project).
China Harbour Engineering Company Limited (CHEC)
was awarded by HyD as the Contractor to undertake the construction work of the
Project.
ENVIRON Hong Kong Ltd. was employed by HyD as the
Independent Environmental Checker (IEC) and Environmental
Project Office (ENPO) for the Project.
AECOM Asia Co. Ltd. (AECOM) was appointed by CHEC
to undertake the role of Environmental Team for the Project for carrying out
the environmental monitoring and audit (EM&A) works.
The
construction phase of the Project under the EPs was commenced on 12 March 2012
and will be tentatively completed by early Year 2016. The EM&A programme,
including air quality, noise, water quality and dolphin monitoring and
environmental site inspections, was commenced on 12 March 2012.
This report documents the findings of EM&A works
conducted in the period between 1 September 2013 and 30 November 2013. As
informed by the Contractor, major activities in the reporting quarter were:-
Marine-based Works
-
Cellular structure installation
-
Connecting arc cell installation
-
Laying geo-textile
-
Sand blanket laying
-
Sand filling
-
Maintenance of silt curtain & silt screen at sea water intake of
HKIA
-
Stone column installation
-
Laying stone blanket
-
Band drain installation
-
Backfill cellular structure
-
Instrumentation works
-
Rubble mound seawall construction
-
Construction of temporary seawall
-
Ground investigation
Land-based Works
-
Maintenance works of Site Office at Works Area WA2
-
Maintenance works of Public Works Regional Laboratory at Works Area
WA3
-
Geo-textile fabrication at Works Area WA2
-
Silt curtain fabrication at Works Area WA4
-
Maintenance of Temporary Marine Access at Works Area WA2
A summary of monitoring and audit activities conducted
in the reporting quarter is listed below:
|
24-hour
Total Suspended Particulates (TSP) monitoring
1-hour
TSP monitoring
|
16 sessions
16 sessions
|
|
Noise monitoring
|
12 sessions
|
|
Impact
water quality monitoring
|
38 sessions
|
|
Impact
dolphin monitoring
|
6 surveys
|
|
Joint
Environmental site inspection
|
13 sessions
|
Breaches of Action and
Limit Levels for Air Quality
All 1-Hour TSP results were below the Action and Limit Level in the
reporting quarter. Five (5) 24-hour TSP results recorded at AMS3A exceeded the
Action Level and one (1) 24-hour TSP results recorded at AMS3A exceeded the
Limit Level in the reporting quarter. Investigation results show that the
exceedances were not related to Project.
Breaches of Action and
Limit Levels for Noise
For construction noise, no exceedance was recorded at all monitoring
stations in the reporting period.
Breaches of Action and Limit Levels for Water Quality
Twenty eight (28) Action Level
Exceedances were recorded at measured suspended solids (SS) values (in mg/L) in
the reporting quarter. (2) Limit Level Exceedances were recorded at measured
suspended solids (SS) values (in mg/L) in the reporting quarter. Investigation
results show that the exceedances were not related to Project.
Breaches of Action and
Limit Levels for Impact Dolphin Monitoring
Two (2) Action Level exceedances of dolphin monitoring were recorded in
the reporting quarter. The investigation results showed that although no
unacceptable changes in environmental parameters of this project have been
measured, at this time it is not possible to make a conclusive assessment of
this Project’s specific impact on dolphins.
Implementation
Status and Review of Environmental Mitigation Measures
Most of the recommended
mitigation measures, as included in the EM&A programme, were implemented
properly in the reporting quarter.
The recommended
environmental mitigation measures effectively minimize the potential
environmental impacts from the Project. The EM&A programme effectively
monitored the environmental impacts from the construction activities and ensure
the proper implementation of mitigation measures. No particular recommendation
was advised for the improvement of the programme.
Moreover, regular review
and checking on the construction methodologies, working processes and plants
were carried out to ensure the environmental impacts were kept minimal and
recommended environmental mitigation measures were implemented effectively.
Complaint, Notification of
Summons and Successful Prosecution
One (1)
complaint was logged by the Contractor regarding the leakage from work barges
causing water pollution near Tuen Mun Richland Garden received on 26 Sept 13.
With refer to the available information such as photo record of the incident
cannot indicate that the leakage from work barges was caused by the vessel of
this Contract and the complaint could not be concluded as project related.
As informed by
the Contractor on 5 Nov 13, one (1) noise complaint received on 14 Sept 13 was
referred to the Contractor of HKBCF on 1 Nov 13. After investigation, the noise
complaint was considered as non-project related.
One (1)
complaint received from Penta-Ocean – Gitanes Joint Venture (CV/2012/03)
mentioned that the formation works of the Contaminated Mud Pit CMP1 to the
South of the Brothers (CMP1 of SB) which has been completed in mid-August 2013
and the pit has been commissioned for receiving contaminated marine mud from
other projects starting from 16 August 2013. However, it was recently observed that
some of the project vessels of HY/2010/02 had berthed within the said pit and
those anchorages would likely cause disruption to the underlying contaminated
mud and thus induce unfavourable contamination impact to the surrounding marine
environment. In this regard, they reminded the contractor to avoid berthing of
their vessels within the boundary of CMP1 of SB thereafter for the sake of
environmental concern. After
investigation, the complaint is considered not likely to be related to the
construction works.
One (1) follow
up enquiry of the same issue mentioned in a complaint reported in the EM&A
report (Sept 13) was logged by the Contractor on 9 Oct 2013. The enquirer
expressed concern of the leakage from work barges causing water pollution at
sea near Tuen Mun Richland Garden and the impact of fishery activities.
Although with refer to the available information such as photo record of the
incident cannot indicate that the leakage from work barges was caused by the vessel
of this Contract and the complaint could not be concluded as project related.
No notification of summons and successful
prosecution was received in the reporting period.
1.1.1
Contract No. HY/2010/02 – Hong Kong-Zhuhai-Macao Bridge
Hong Kong Boundary Crossing
Facilities – Reclamation Work (here below, known as “the Project”) mainly
comprises seawall
construction and reclamation at the northeast of
the Hong Kong International Airport of
an area of
about 130-hectare for
the construction of an artificial island for the development of the Hong
Kong Boundary Crossing Facilities (HKBCF), and about 19-hectare for the
southern landfall of the Tuen Mun - Chek Lap Kok Link (TMCLKL).
1.1.2
The
environmental impact assessment (EIA) reports (Hong Kong –
Zhuhai – Macao Bridge Hong Kong Boundary Crossing
Facilities – EIA Report (Register No. AEIAR-145/2009) (HKBCFEIA) and Tuen Mun –
Chek Lap Kok Link – EIA Report (Register No. AEIAR-146/2009) (TMCLKLEIA), and
their environmental monitoring and audit (EM&A) Manuals (original EM&A
Manuals), for the Project were approved by Environmental Protection Department
(EPD) in October 2009.
1.1.3
EPD
subsequently issued the
Environmental Permit (EP) for HKBCF in November 2009 (EP-353/2009)
and the Variation of Environmental Permit (VEP) in June 2010
(EP-353/2009/A), November 2010 (EP-353/2009/B), November 2011 (EP-353/2009/C), March 2012
(EP-353/2009/D), October 2012 (EP-353/2009/E), April 2013 (EP-353/2009/F) and
August 2013 (EP-353/2009/G). Similarly, EPD issued the Environmental Permit
(EP) for TMCLKL in November 2009 (EP-354/2009) and the Variation of
Environmental Permit (VEP) in December 2010 (EP-354/2009/A) and January 2014
(EP-354/2009/B).
1.1.4
The
Project is a designated project and is governed by the current permits for the
Project, i.e. the amended EPs issued on 6 August 2013 (EP-353/2009/G) and 28
January 2014 (EP-354/2009/B) (for TMCLKL Southern Landfall Reclamation only).
1.1.5
A Project Specific EM&A Manual, which included all project-relation
contents from the original EM&A Manuals for the Project, was issued in May 2012.
1.1.6
Ove Arup & Partners Hong Kong Limited (Arup) was
appointed by Highways Department (HyD) as the consultants for the design and
construction assignment for the Project’s reclamation works (i.e. the Engineer
for the Project).
1.1.7
China Harbour Engineering Company Limited (CHEC) was
awarded by HyD as the Contractor to undertake the construction work of the
Project.
1.1.8
ENVIRON Hong Kong Ltd. was employed by HyD as the Independent
Environmental Checker (IEC) and Environmental Project Office (ENPO) for the
Project.
1.1.9
AECOM Asia Co. Ltd. (AECOM) was appointed by CHEC to
undertake the role of Environmental Team for the Project for carrying out the
EM&A works.
1.1.10
The construction phase of the Project under the EPs was
commenced on 12 March 2012 and will be tentatively completed by early Year
2016.
1.1.11
According to the Project Specific EM&A Manual, there is
a need of an EM&A programme including air quality, noise, water quality and
dolphin monitoring and environmental site inspections. The EM&A programme
of the Project commenced on 12 March 2012.
1.2
Scope of Report
1.2.1
This is the
seventh quarterly EM&A Report under the Contract No. HY/2010/02 Hong Kong-Zhuhai-Macao
Bridge Hong Kong Boundary Crossing Facilities – Reclamation Works. This report
presents a summary of the environmental monitoring and audit works, list of
activities and mitigation measures proposed by the ET for the Project from 1 September 2013 and 30 November 2013.
1.3.1
The project organization structure is shown in Appendix A.
The key personnel contact names and numbers are summarized in Table 1.1.
Table 1.1 Contact
Information of Key Personnel
|
Party
|
Position
|
Name
|
Telephone
|
Fax
|
|
Engineer’s Representative (ER)
(Ove
Arup & Partners Hong Kong Limited)
|
Chief Resident Engineer
|
Roger Marechal
|
2528 3031
|
2668 3970
|
|
IEC / ENPO
(ENVIRON Hong Kong Limited)
|
Independent Environmental Checker
|
Raymond Dai
|
3465
2888
|
3548 6988
|
|
Environmental Project Office Leader
|
Y.H. Hui
|
3465 2868
|
3465 2899
|
|
Contractor
(China Harbour Engineering
Company Limited)
|
General Manager (S&E)
|
Daniel Leung
|
3157 1086
|
2578 0413
|
|
Environmental Officer
|
Richard Ng
|
36932253
|
2578 0413
|
|
24-hour Hotline
|
Alan C.C. Yeung
|
9448 0325
|
--
|
|
ET
(AECOM
Asia Company Limited)
|
ET Leader
|
Echo Leong
|
3922 9280
|
2317 7609
|
1.4.1 The construction phase of the Project under the EP
commenced on 12 March 2012.
1.4.2 As informed by the Contractor, details of the major works
carried out in the reporting quarter are listed below:-
Marine-based Works
-
Cellular structure installation
-
Connecting arc cell installation
-
Laying geo-textile
-
Sand blanket laying
-
Sand filling
-
Maintenance of silt curtain & silt screen at sea water intake of
HKIA
-
Stone column installation
-
Laying stone blanket
-
Band drain installation
-
Backfill cellular structure
-
Instrumentation works
-
Rubble mound seawall construction
-
Construction of temporary seawall
-
Ground investigation
Land-based Works
-
Maintenance works of Site Office at Works Area WA2
-
Maintenance works of Public Works Regional Laboratory at Works Area
WA3
-
Geo-textile fabrication at Works Area WA2
-
Silt curtain fabrication at Works Area WA4
-
Maintenance of Temporary Marine Access at Works Area WA2
1.4.3 The 3-month rolling construction programme of the Project
is shown in Appendix B.
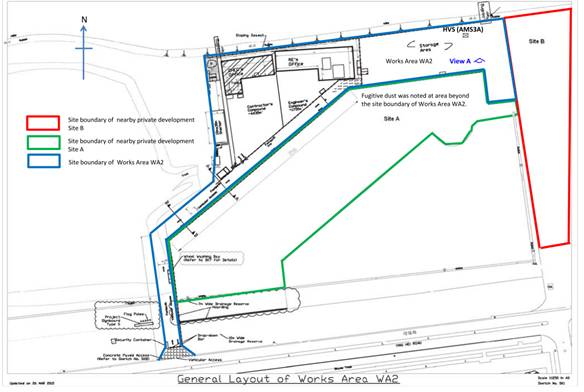
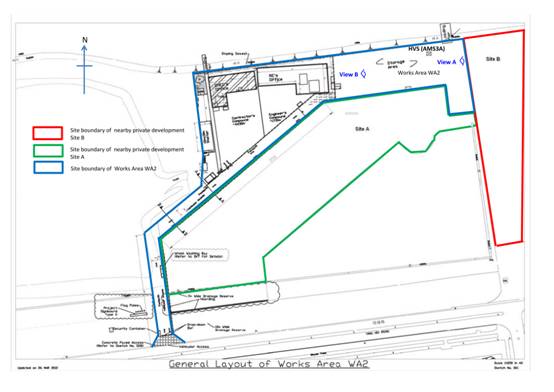
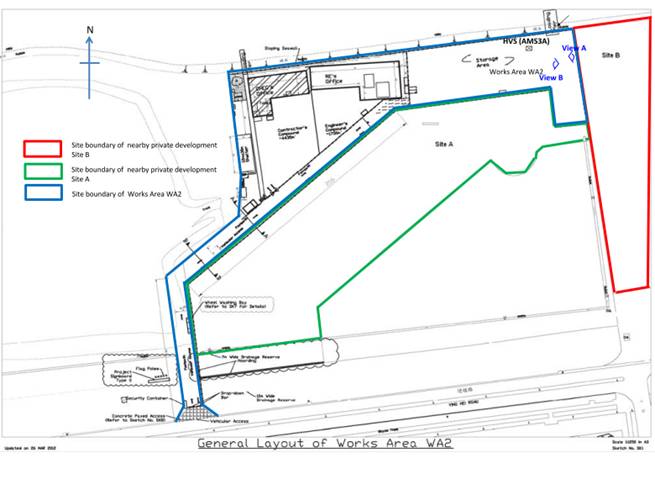
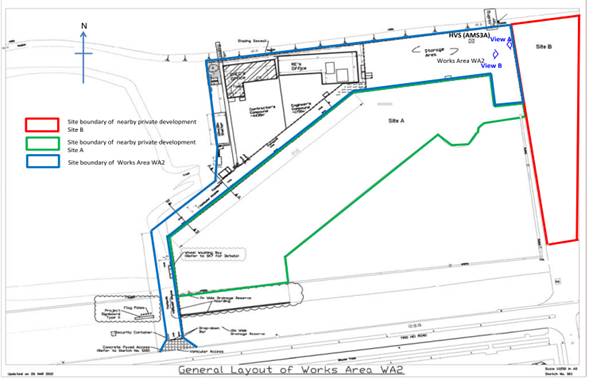
1.4.4 The general layout plan of the Project site showing the detailed
works areas is shown in Figure 1.
1.4.5 The environmental mitigation measures implementation
schedule are presented in Appendix C.
2.1.1
The Project Specific EM&A Manual designated 4 air
quality monitoring stations, 2 noise monitoring stations, 21 water monitoring
stations (9 Impact Stations, 7 Sensitive Receiver Stations and 5 Control/Far
Field Stations) to monitor environmental impacts on air quality, noise and
water quality respectively. Pre-set and fixed transect line vessel based
dolphin survey was required in two AFCD designated areas (Northeast and
Northwest Lantau survey areas). The impact dolphin monitoring at each survey
area should be conducted twice per month.
2.1.2
For impact air quality monitoring, monitoring locations
AMS2 (Tung Chung Development Pier) and AMS7 (Hong Kong SkyCity Marriott Hotel)
were set up at the proposed locations in accordance with Project Specific
EM&A Manual. The conditional omission of Monitoring Station AMS6 was
effective since 19 November 2012. For monitoring location AMS3 (Ho Yu College),
as proposed in the Project Specific EM&A Manual, approval for carrying out
impact monitoring could not be obtained from the principal of the school. Permission
on setting up and carrying out impact monitoring works at nearby sensitive
receivers, like Caribbean Coast and Coastal Skyline, was also sought. However, approvals for carrying out
impact monitoring works within their premises were not obtained. Impact air
quality monitoring was conducted at site boundary of the site office area in
Works Area WA2 (AMS3A) respectively. Same baseline and Action Level for air
quality, as derived from the baseline monitoring data recorded at Ho Yu
College, was adopted for this alternative air quality location.
2.1.3
For impact noise monitoring, monitoring locations NMS2
(Seaview Crescent Tower 1) was set up at the proposed locations in accordance
with Project Specific EM&A Manual. However, for monitoring location NMS3
(Ho Yu College), as proposed in the Project Specific EM&A Manual, approval
for carrying out impact monitoring could not be obtained from the principal of
the school. Permission on setting up and carrying out impact monitoring works
at nearby sensitive receivers, like Caribbean Coast and Coastal Skyline, was
also sought. However, approvals for
carrying out impact monitoring works within their premises were not obtained.
Impact noise monitoring was conducted at site boundary of the site office area
in Works Area WA2 (NMS3A) respectively. Same baseline noise level, as derived
from the baseline monitoring data recorded at Ho Yu College was adopted for
this alternative noise monitoring location.
2.1.4
In accordance with the Project Specific EM&A Manual,
twenty-one stations were designated for impact water quality monitoring. The
nine Impact Stations (IS) were chosen on the basis of their proximity to the
reclamation and thus the greatest potential for water quality impacts, the
seven Sensitive Receiver Stations (SR) were chosen as they are close to the key
sensitive receives and the five Control/ Far Field Stations (CS) were chosen to
facilitate comparison of the water quality of the IS stations with less
influence by the Project/ ambient water quality conditions.
2.1.5
Due to safety concern and topographical condition of the
original locations of SR4 and SR10B, alternative impact water quality
monitoring stations, naming as SR4(N) and SR10B(N), were adopted, which are
situated in vicinity of the original impact water quality monitoring stations
(SR4 and SR10B) and could be reachable. Same baseline and Action Level for
water quality, as derived from the baseline monitoring data recorded, were
adopted for these alternative impact water quality monitoring stations.
2.1.6
The monitoring locations used during the reporting quarter
are depicted in Figures 2, 3 and 4 respectively.
2.1.7
The Project Specific EM&A Manual also required
environmental site inspections for air quality, noise, water quality, chemical,
waste management, marine ecology and landscape and visual impact.
2.2.1
The environmental quality performance limits (i.e. Action
and/or Limit Levels) of air and water quality monitoring were derived from the baseline air and
water quality monitoring
results at the respective monitoring stations, while the environmental quality
performance limits of noise monitoring were defined in the EM&A Manual.
2.2.2
The environmental quality performance limits of air
quality, noise and water monitoring are given in Appendix D.
2.3.1
Relevant environmental mitigation measures were stipulated
in the Particular Specification and EPs (EP-353/2009/G and EP-354/2009/B) (for TMCLKL Southern Landfall
Reclamation only) for the Contractor to adopt. A list of environmental
mitigation measures and their implementation statuses are given in Appendix C.
3.1.1
In accordance with the Project Specific EM&A Manual,
impact 1-hour Total Suspended Particulates (TSP) monitoring was conducted for
at least three times every 6 days, while impact 24-hour TSP monitoring was
carried out for at least once every 6 days at the 4 monitoring stations (AMS2,
AMS3A, AMS6 and AMS7).
3.1.2
The
monitoring locations for impact air quality monitoring are depicted in Figure
2. However, for AMS6 (Dragonair/CNAC (Group) Building), permission on setting
up and carrying out impact monitoring works was sought, however, access to the
premise has not been granted yet on this report issuing date.
3.1.3
The weather was mostly sunny, with occasional cloudy and occasional rainy in the
reporting quarter. The major dust source in the reporting quarter
included construction activities from the Project, as well as nearby traffic
emissions.
3.1.4
The number of monitoring events and exceedances recorded in
each month of the reporting quarter are presented in Table 3.1 and Table 3.2
respectively.
Table 3.1 Summary of Number of Monitoring Events for 1-hr &
24-hr TSP Concentration
|
Monitoring Parameter
|
Location
|
No. of monitoring events
|
|
September 13
|
October 13
|
November 13
|
|
1-hr TSP
|
AMS2
|
16
|
18
|
16
|
|
AMS3A
|
16
|
18
|
16
|
|
AMS7
|
16
|
18
|
16
|
|
24-hr TSP
|
AMS2
|
5
|
6
|
5
|
|
AMS3A
|
5
|
6
|
5
|
|
AMS7
|
5
|
6
|
5
|
Table
3.2 Summary of Number of
Exceedances for 1-hr & 24-hr TSP Monitoring
|
Monitoring Parameter
|
Location
|
Level of Exceedance
|
Level of Exceedance
|
|
September 13
|
October 13
|
November 13
|
|
1-hr TSP
|
AMS2
|
Action
|
0
|
0
|
0
|
|
Limit
|
0
|
0
|
0
|
|
AMS3A
|
Action
|
0
|
0
|
0
|
|
Limit
|
0
|
0
|
0
|
|
AMS7
|
Action
|
0
|
0
|
0
|
|
Limit
|
0
|
0
|
0
|
|
|
Total
|
0
|
0
|
0
|
|
24-hr TSP
|
AMS2
|
Action
|
0
|
0
|
0
|
|
Limit
|
0
|
0
|
0
|
|
AMS3A
|
Action
|
1
|
2
|
2
|
|
Limit
|
0
|
0
|
1
|
|
AMS7
|
Action
|
0
|
0
|
0
|
|
Limit
|
0
|
0
|
0
|
|
|
Total
|
1
|
2
|
3
|
3.1.5
All 1-Hour TSP results were below the Action and Limit
Level in the reporting quarter. Five (5) 24-hour TSP results recorded at AMS3A exceeded
the Action Level and one (1) 24-hour TSP results recorded at AMS3A exceeded the
Limit Level in the reporting quarter. Investigation results show that the
exceedances were not related to Project.
3.1.6
For the 24Hr TSP Action Level exceedance recorded at AMS3A,
a result of 173mg/L was
recorded on 19 Sept13 (24-hr TSP).
3.1.6.1
According to information provided by the
Contractor, land-based construction activity such as installing and
transloading of sand bags, deliver & transloading band drain material to
site container and stitching geotextile were being undertaken at Works Area WA2
during the monitoring period.
3.1.6.2
Functional checking on HVS at AMS3A was
done. Air flow of the HVS was checked and the flow was steady during the 24-hr
TSP sampling at AMS3A. The filter paper was re-weighted by the assigned HOKLAS
laboratory and the result was reconfirmed.
3.1.6.3
As refer to the wind data collected at
wind station at Works Area WA2 during the monitoring period on 18 and 19
September 13, East South East winds was prevailing during the monitoring
period.
3.1.6.4
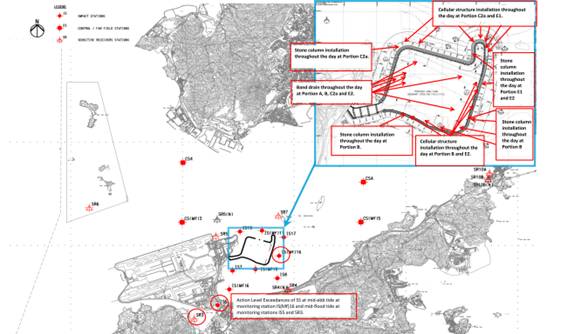
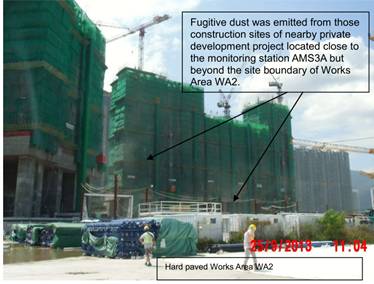
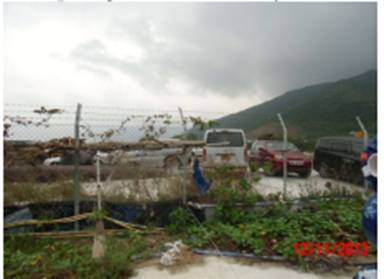
Photo record shows that fugitive dust was
emitted from the construction sites of nearby private development project
located close to the monitoring station AMS3A but beyond the site boundary of
Works Area WA2. With reference to the prevailing East South East wind
direction, construction works carried out at construction sites of nearby
private development project may contribute to the measured dust levels at the
monitoring station AMS3A. (Please also see photo and layout map below for
reference of site conditions.)
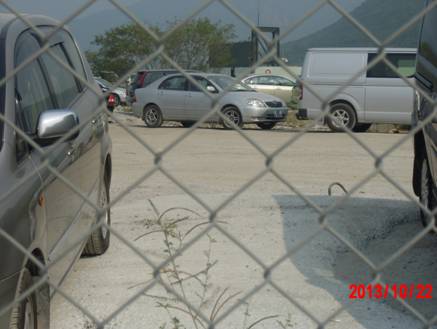
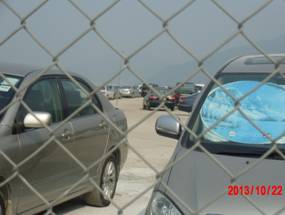
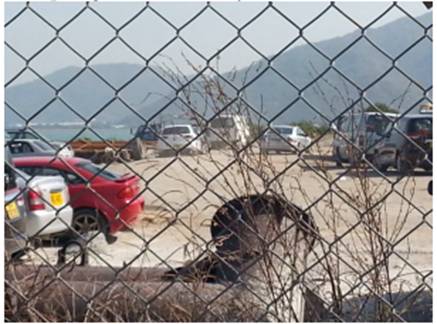
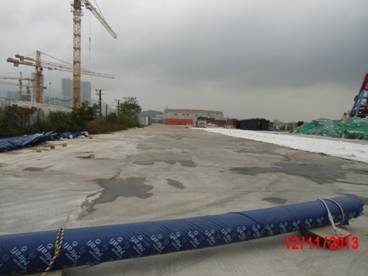
Conditions
of the construction sites near Works Area WA2:
View
of Works Area WA2 : the hard paved ground next to monitoring station AMS3A
(View A on layout map)
3.1.6.5
Construction works carried out at construction
sites of nearby private development project may contribute to the measured dust
levels at the monitoring station AMS3A. The 1-hr TSP values recorded at AMS3A
on 19 Sept 13, which are within the monitoring period of the 24-hr TSP, were 78
mg/m3, 77 mg/m3
and 77mg/m3
respectively. All measured values are well below the Action and Limit Levels.
3.1.6.6
The measured 24-hr TSP values recorded at
AMS2 and AMS7 (which are closer to the marine-based works areas) on the same
monitoring date were 79 mg/m3
and 70 mg/m3
respectively, which are below the Action and Limit Levels.
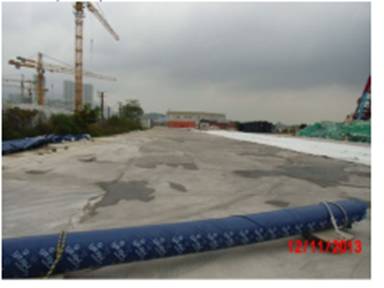
3.1.6.7
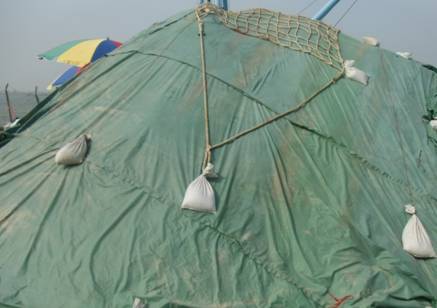
The following dust mitigation measures
have been implemented at Works Area WA2:
1. Works Area WA2’s surface was
hard-paved, compacted or hydro-seeded
2. Vehicle washing facility was provided
at vehicle exit points,
3. Measures for preventing fugitive
dust emission are provided, e.g. tarpaulin covers.
3.1.6.8
The dust exceedance was therefore
considered not to be due to the Project works.
3.1.6.9
The Contractor was recommended to continue
implementing existing dust mitigation measures.
3.1.7
For the 24Hr TSP Action Level
exceedance recorded at AMS3A, a result of 198mg/m3 was
recorded on 15 Oct 13 (24-hr TSP).
3.1.9.1
According to information provided by the
Contractor, land-based construction activity such as using canvas to cover sand
material, sampling geotextile material and stitching geotextile were being
undertaken at Works Area WA2 during the monitoring period.
3.1.9.2
Functional checking on HVS at AMS3A was
done. Air flow of the HVS was checked and the flow was steady during the 24-hr
TSP sampling at AMS3A. The filter paper was re-weighted by the assigned HOKLAS
laboratory and the result was reconfirmed.
3.1.9.3
Photo records shows that vehicle would
travel on exposed soil surfaces at those construction sites of nearby private
development project which are close to the monitoring station AMS3A but beyond
the site boundary of Works Area WA2. (Please also see photo and layout map
attached for reference of site conditions.)
3.1.9.4
As refer to the wind data collected at wind
station at Works Area WA2 during the monitoring period on 15 and 16 Oct 13 (as
attached) East South East winds was prevailing during the monitoring period.
Traffics at construction sites of nearby private development project which are
close to the monitoring station AMS3A but beyond the site boundary of Works
Area WA 2 may contribute to the measured dust levels at the monitoring station
AMS3A.

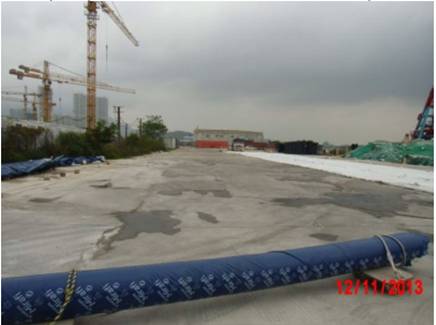
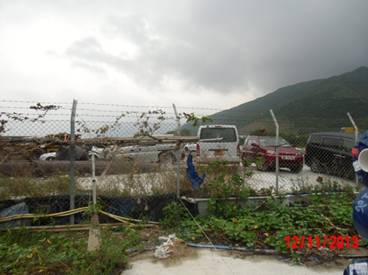
Conditions
of the construction sites near Works Area WA2:
View
A: (Canvas was used to cover sand material
stored at WA2):
View B: (Traffic on dusty surface observed
at nearby construction site which do not belongs to this Contract)
3.1.9.5
The 1-hr TSP values recorded at AMS3A on
15 Oct 13, which are within the monitoring period of the 24-hr TSP, were 87mg/m3,
85mg/m3
and 87mg/m3 respectively. All measured values are well below
the Action and Limit Levels.
3.1.9.6
The measured 24-hr TSP values recorded at AMS2
and AMS7 (which are closer to the marine-based works areas) on the same
monitoring date were 97mg/m3
and 92mg/m3
respectively, which are below the Action and Limit Levels.
3.1.9.7
The following dust mitigation measures
have been implemented at Works Area WA2:
1. Canvas/tarpaulin sheet was used
to cover sand material stored at WA2 (please refer to photo record – View A
above)
2. Works Area WA2’s surface was
hard-paved, compacted or hydro-seeded
3. Vehicle washing facility was
provided at vehicle exit points,
3.1.9.8
The dust exceedance was therefore
considered not to be due to the Project works.
3.1.9.9
The Contractor was recommended to continue
implementing existing dust mitigation measures.
3.1.8
For the 24Hr TSP Action Level
exceedance recorded at AMS3A, a result of 194mg/m3 was recorded on 19 Oct 13 (24-hr TSP).
3.1.8.1 According to information provided
by the Contractor, land-based construction activity such as stitching
geotextile, transloading stitching geotextile and tidy up the stitching area
were being undertaken at Works Area WA2 during the monitoring period.
3.1.8.2 Functional checking on HVS at
AMS3A was done. Air flow of the HVS was checked and the flow was steady during
the 24-hr TSP sampling at AMS3A. The filter paper was re-weighted by the
assigned HOKLAS laboratory and the result was reconfirmed.
3.1.8.3 Photo records shows that vehicle
would travel on exposed soil surfaces at those construction sites of nearby
private development project which are close to the monitoring station AMS3A but
beyond the site boundary of Works Area WA2. (Please also see photo and layout
map attached for reference of site conditions (View A.)
Photo
record:
View A (Traffic on dusty surface observed
at nearby construction site which do not belongs to this Contract)
View B (Hard paved surface observed at Works
Area WA2)
3.1.8.4 As refer to the wind data
collected at wind station at Works Area WA2 during the monitoring period on 18
and 19 Oct 13 (as attached) south-southeast winds was prevailing during the
monitoring period. Traffics at construction sites of nearby private development
project which are close to the monitoring station AMS3A but beyond the site
boundary of Works Area WA 2 may contribute to the measured dust levels at the
monitoring station AMS3A.
3.1.8.5 The 1-hr TSP values recorded at
AMS3A on 19 Oct 13, which are within the monitoring period of the 24-hr TSP,
were 85mg/m3, 85mg/m3 and 84mg/m3 respectively. All
measured values are well below the Action and Limit Levels.
3.1.8.6 The measured 24-hr TSP values
recorded at AMS2 and AMS7 (which are closer to the marine-based works areas) on
the same monitoring date were 116mg/m3 and 101mg/m3 respectively,
which are below the Action and Limit Levels.
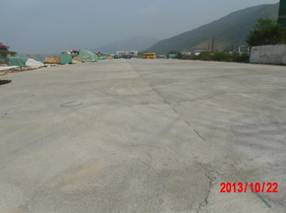
3.1.8.7 The following dust mitigation
measures have been implemented at Works Area WA2:
1. Works Area WA2’s surface was
hard-paved, compacted or hydro-seeded (Please refer to attached layout map and
photo record (View B))
2. Vehicle washing facility was
provided at vehicle exit points,
3. Measures for preventing fugitive
dust emission are provided, e.g. canvas/tarpaulin covers.
3.1.8.8 The dust exceedance was therefore
considered not to be due to the Project works.
3.1.8.9 The Contractor was recommended to
continue implementing existing dust mitigation measures.
3.1.9
For the 24Hr TSP Action Level
exceedance recorded at AMS3A, a result of 221mg/m3 was recorded on 12 Nov 13 (24-hr TSP).
3.1.9.1
According to information provided by the
Contractor, land-based construction activity such as installation of sand bags,
transloading band drain material and sampling for Type 2 geotextile were being
undertaken at Works Area WA2 during the monitoring period.
3.1.9.2
Functional checking on HVS at AMS3A was
done. Air flow of the HVS was checked and the flow was steady during the 24-hr
TSP sampling at AMS3A. The filter paper was re-weighted by the assigned HOKLAS
laboratory and the result was reconfirmed.
3.1.9.3
Photo records shows vehicle parking
activities were observed inside an area at construction sites of nearby private
development project which are close to the monitoring station AMS3A but beyond
the site boundary of Works Area WA2. (Please also see photo and layout map
attached for reference of site conditions (View A.))
3.1.9.4
As refer to the wind data collected at
wind station at Works Area WA2 during the monitoring period on 11 and 12 Nov 13
(as attached) southeast winds was prevailing during the monitoring period.
Traffic activities at construction sites of nearby private development project
which are close to the monitoring station AMS3A but beyond the site boundary of
Works Area WA 2 may contribute to the measured dust levels at the monitoring
station AMS3A.
Conditions of the construction sites near
Works Area WA2:
View A: (Parking lot observed at nearby construction site which do not belongs to
this Contract):
View B (Hard paved surface
observed at Works Area WA2)
3.1.9.5
The 1-hr TSP values recorded at AMS3A on
12 Nov 13, which are within the monitoring period of the 24-hr TSP, were
86μg/m3, 87μg/m3 and 86μg/m3 respectively. All measured values are well below
the Action and Limit Levels.
3.1.9.6
The measured 24-hr TSP values recorded at
AMS2 and AMS7 (which are closer to the marine-based works areas) on the same
monitoring date were 60μg/m3 and 57μg/m3 respectively, which are below the
Action and Limit Levels.
3.1.9.7
The following dust mitigation measures have
been implemented at Works Area WA2:
1. Works Area WA2’s surface was
hard-paved, compacted or hydro-seeded (Please refer to attached layout map and
photo record (View B))
2. Vehicle washing facility was
provided at vehicle exit points,
3. Measures for preventing fugitive
dust emission are provided, e.g. canvas/tarpaulin covers.
3.1.9.8
The dust exceedance was therefore
considered not to be due to the Project works.
3.1.9.9 The
Contractor was recommended to continue implementing existing dust mitigation
measures.
3.1.10
For the 24Hr TSP Action Level
exceedance recorded at AMS3A, a result of 244mg/m3 was recorded on 18 Nov 13 (24-hr TSP).
3.1.10.1 According to information provided
by the Contractor, land-based construction activity such as installation of
sand bags and stitching Type 2 geotextile were being undertaken at Works Area
WA2 during the monitoring period.
3.1.10.2 Functional checking on HVS at
AMS3A was done. Air flow of the HVS was checked and the flow was steady during
the 24-hr TSP sampling at AMS3A. The filter paper was re-weighted by the
assigned HOKLAS laboratory and the result was reconfirmed.
3.1.10.3 Photo records shows vehicle
parking activities were observed inside an area at construction sites of nearby
private development project which are close to the monitoring station AMS3A but
beyond the site boundary of Works Area WA2. (Please also see photo and layout
map attached for reference of site conditions (View A.))
Photo
record:
View A (parking lot
observed at nearby construction site which do not belongs to this Contract)
View B (Hard paved surface observed at
Works Area WA2)
3.1.10.4 As refer to the wind data
collected at wind station at Works Area WA2 during the monitoring period on 18
and 19 Nov 13 (as attached) southeast winds was prevailing during the
monitoring period. Traffic activities at construction sites of nearby private
development project which are close to the monitoring station AMS3A but beyond
the site boundary of Works Area WA 2 may contribute to the measured dust levels
at the monitoring station AMS3A.
3.1.10.5 The 1-hr TSP values recorded at
AMS3A on 18 Nov 13, which are within the monitoring period of the 24-hr TSP, were
84μg/m3, 84μg/m3 and 86μg/m3 respectively. All measured values are well below
the Action and Limit Levels.
3.1.10.6 The measured 24-hr TSP values
recorded at AMS2 and AMS7 (which are closer to the marine-based works areas) on
the same monitoring date were 125μg/m3 and 118μg/m3 respectively, which are
below the Action and Limit Levels.
3.1.10.7 The following dust mitigation
measures have been implemented at Works Area WA2:
1. Works Area WA2’s surface was
hard-paved, compacted or hydro-seeded (Please refer to attached layout map and
photo record (View B))
2. Vehicle washing facility was
provided at vehicle exit points,
3. Measures for preventing fugitive
dust emission are provided, e.g. canvas/tarpaulin covers.
3.1.10.8 The dust exceedance was therefore
considered not to be due to the Project works.
3.1.10.9
The Contractor was recommended to continue implementing existing dust
mitigation measures.
3.1.11 For the
24Hr TSP Action Level exceedance recorded at AMS3A, a result of 518μg/m3
was recorded on 23 Nov 13 (24-hr TSP).
3.1.11.1 According to information provided
by the Contractor, land-based construction activity such as installation of
sand bags, transloading band drain material and sampling for Type 2 geotextile
were being undertaken at Works Area WA2 during the monitoring period.
3.1.11.2 Functional checking on HVS at
AMS3A was done. Air flow of the HVS was checked and the flow was steady during
the 24-hr TSP sampling at AMS3A. The filter paper was re-weighted by the
assigned HOKLAS laboratory and the result was reconfirmed.
3.1.11.3 Photo records shows vehicle parking activities were
observed inside an area at construction sites of nearby private development
project which are close to the monitoring station AMS3A but beyond the site
boundary of Works Area WA2. (Please also see photo and layout map attached for
reference of site conditions (View A.))
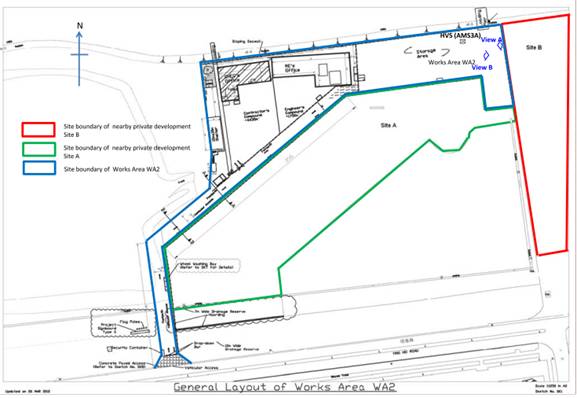
Photo record:
View A (parking lot observed at nearby construction site which do
not belongs to this Contract)
View B (Hard paved surface observed at Works Area WA2)
3.1.11.4 As refer to the wind data
collected at wind station at Works Area WA2 during the monitoring period on 22 and 23 Nov 13 (as attached) southeast
winds was prevailing during the monitoring period. Traffic activities at
construction sites of nearby private development project which are close to the
monitoring station AMS3A but beyond the site boundary of Works Area WA 2 may
contribute to the measured dust levels at the monitoring station AMS3A.
3.1.11.5 The 1-hr TSP values recorded at
AMS3A on 23 Nov 13, which are within the
monitoring period of the 24-hr TSP, were 86μg/m3, 87μg/m3 and 86μg/m3
respectively. All measured values are well below the Action and Limit Levels.
3.1.11.6 The measured 24-hr TSP values recorded
at AMS2 and AMS7 (which are closer to the marine-based works areas) on the same
monitoring date were 60μg/m3 and 57μg/m3 respectively, which are below the
Action and Limit Levels.
3.1.11.7 The following dust mitigation
measures have been implemented at Works Area WA2:
1. Works Area WA2’s surface was
hard-paved, compacted or hydro-seeded (Please refer to attached layout map and
photo record (View B))
2. Vehicle washing facility was
provided at vehicle exit points,
3. Measures for preventing fugitive
dust emission are provided, e.g. canvas/tarpaulin covers.
3.1.11.8 The dust exceedance was therefore
considered not to be due to the Project works.
3.1.11.9 The Contractor was recommended to
continue implementing existing dust mitigation measures.
3.1.12
The graphical plots of the trends of the monitoring results
are provided in Appendix E. No specific trend of the monitoring results or
existence of persistent pollution source was noted.
3.1.13
The event action plan is annexed in Appendix L.
3.2.1
Impact noise monitoring was conducted at the 2 monitoring
stations (NMS2 and NMS3A) for at least once per week during 07:00 – 19:00 in the
reporting quarter.
3.2.2
The monitoring locations used during the reporting quarter are
depicted in Figure 2.
3.2.3
No Action
or Limit Level Exceedance of construction noise was recorded in the
reporting quarter.
3.2.4
Major noise sources during the noise monitoring included
construction activities of the Project and nearby traffic noise.
3.2.5
The number of impact noise monitoring events and
exceedances are summarized in Table 3.3 and
Table 3.4
respectively
Table 3.3 Summary
of Number of Monitoring Events for Impact Noise
|
Monitoring
Parameter
|
Location
|
No.
of monitoring events
|
|
September 13
|
October 13
|
November 13
|
|
NMS2
|
4
|
4
|
4
|
|
NMS3A
|
4
|
4
|
4
|
Table 3.4 Summary
of Number of Monitoring Exceedances for Impact Noise
|
Monitoring Parameter
|
Location
|
Level of Exceedance
|
Level of Exceedance
|
|
September 13
|
October
13
|
November 13
|
|
NMS2
|
Action
|
0
|
0
|
0
|
|
Limit
|
0
|
0
|
0
|
|
NMS3A
|
Action
|
0
|
0
|
0
|
|
Limit
|
0
|
0
|
0
|
|
|
Total
|
0
|
0
|
0
|
3.2.6
The
graphical plots of the trends of the monitoring results are provided in
Appendix F. No specific
trend of the monitoring results or existence of persistent pollution source was
noted.
3.2.7
The event action plan is annexed in Appendix L.
3.3
Water Quality Monitoring
3.3.1
The monitoring locations used during the reporting quarter
are depicted in Figure 3.
Table 3.5 Summary
of Water Quality Exceedances in Sept 13- Nov 13
|
Station
|
Exceedance Level
|
DO (S&M)
|
DO (Bottom)
|
Turbidity
|
SS
|
Total
|
|
Ebb
|
Flood
|
Ebb
|
Flood
|
Ebb
|
Flood
|
Ebb
|
Flood
|
Ebb
|
Flood
|
|
IS5
|
Action
|
0
|
0
|
0
|
0
|
0
|
0
|
0
|
(1)
22 Nov13
|
0
|
1
|
|
Limit
|
0
|
0
|
0
|
0
|
0
|
0
|
0
|
0
|
0
|
0
|
|
IS(Mf)6
|
Action
|
0
|
0
|
0
|
0
|
0
|
0
|
(2)
11 Nov
13 and 16 Sept 13
|
(2)
11 & 20 Nov
13
|
2
|
2
|
|
Limit
|
0
|
0
|
0
|
0
|
0
|
0
|
0
|
0
|
0
|
0
|
|
IS7
|
Action
|
0
|
0
|
0
|
0
|
0
|
0
|
0
|
(2)
20 Nov13 and18 Oct
13
|
0
|
2
|
|
Limit
|
0
|
0
|
0
|
0
|
0
|
0
|
0
|
0
|
0
|
0
|
|
IS8
|
Action
|
0
|
0
|
0
|
0
|
0
|
0
|
0
|
0
|
0
|
0
|
|
Limit
|
0
|
0
|
0
|
0
|
0
|
0
|
0
|
0
|
0
|
0
|
|
IS(Mf)9
|
Action
|
0
|
0
|
0
|
0
|
0
|
0
|
0
|
(3)
15 Nov13, 4 Oct
13 and
6 Sept 13
|
0
|
3
|
|
Limit
|
0
|
0
|
0
|
0
|
0
|
0
|
0
|
0
|
0
|
0
|
|
IS10
|
Action
|
0
|
0
|
0
|
0
|
0
|
0
|
0
|
(3)
6 Nov13,
7 Oct
13 and
30 Sept 13
|
0
|
3
|
|
Limit
|
0
|
0
|
0
|
0
|
0
|
0
|
0
|
(1)
25 Oct
13
|
0
|
1
|
|
IS(Mf)11
|
Action
|
0
|
0
|
0
|
0
|
0
|
0
|
0
|
0
|
0
|
0
|
|
Limit
|
0
|
0
|
0
|
0
|
0
|
0
|
0
|
0
|
0
|
0
|
|
IS(Mf)16
|
Action
|
0
|
0
|
0
|
0
|
0
|
0
|
(3)
4 & 22 Nov
13 and 04 Oct
13
|
(1)
16
Oct
13
|
3
|
1
|
|
Limit
|
0
|
0
|
0
|
0
|
0
|
0
|
0
|
0
|
0
|
0
|
|
IS17
|
Action
|
0
|
0
|
0
|
0
|
0
|
0
|
(2)
4 &15 Nov
13
|
0
|
2
|
0
|
|
Limit
|
0
|
0
|
0
|
0
|
0
|
0
|
0
|
0
|
0
|
0
|
|
SR3
|
Action
|
0
|
0
|
0
|
0
|
0
|
0
|
0
|
(1)
22 Nov13
|
0
|
1
|
|
Limit
|
0
|
0
|
0
|
0
|
0
|
0
|
0
|
0
|
0
|
0
|
|
SR4(N)
|
Action
|
0
|
0
|
0
|
0
|
0
|
0
|
0
|
(2)
13 Nov13 and 18 Sept 13
|
0
|
2
|
|
Limit
|
0
|
0
|
0
|
0
|
0
|
0
|
0
|
0
|
0
|
0
|
|
SR5
|
Action
|
0
|
0
|
0
|
0
|
0
|
0
|
0
|
(3)
6 Nov13, 7 Oct
13 and
30 Sept 13
|
0
|
3
|
|
Limit
|
0
|
0
|
0
|
0
|
0
|
0
|
0
|
(1)
25 Oct
13
|
0
|
1
|
|
SR6
|
Action
|
0
|
0
|
0
|
0
|
0
|
0
|
0
|
(1)
6 Nov13
|
0
|
1
|
|
Limit
|
0
|
0
|
0
|
0
|
0
|
0
|
0
|
0
|
|
|
|
SR7
|
Action
|
0
|
0
|
0
|
0
|
0
|
0
|
0
|
0
|
0
|
0
|
|
Limit
|
0
|
0
|
0
|
0
|
0
|
0
|
0
|
0
|
0
|
0
|
|
SR10A
|
Action
|
0
|
0
|
0
|
0
|
0
|
0
|
0
|
0
|
0
|
0
|
|
Limit
|
0
|
0
|
0
|
0
|
0
|
0
|
0
|
0
|
0
|
0
|
|
SR10B
(N)
|
Action
|
0
|
0
|
0
|
0
|
0
|
0
|
0
|
(2)
6 Nov13 and
21 Oct
13
|
0
|
2
|
|
Limit
|
0
|
0
|
0
|
0
|
0
|
0
|
0
|
0
|
0
|
0
|
|
Total
|
Action
|
0
|
0
|
0
|
0
|
0
|
0
|
7
|
21
|
28
|
|
|
Limit
|
0
|
0
|
0
|
0
|
0
|
0
|
0
|
2
|
2
|
Note: S: Surface;
M: Mid-depth;
3.3.3
One (1)
Action Level exceedance at measured Suspended Solids (mg/L) where recorded on
06 September 2013 during mid-flood tide at monitoring station IS(Mf)9. For
Action Level exceedance at measured Suspended Solids (mg/L), 30.3 mg/L was
recorded at Monitoring Station IS(Mf)9.
3.3.3.1 For
locations and type of active works carried out on 6 Sept 13, please refer to
the above layout map.
3.3.3.2 For
action level exceedance of depth averaged SS (in mg/L) recorded at IS(Mf)9
during mid flood tide, active works were carried out at almost the same
locations on 4, 6 and 9 Sept 13, but all depth averaged SS (in mg/L) results
recorded at all monitoring location on 4 and 9 Sept 13 were all below the Action
and Limit Level, which indicates that active works are unlikely to contribute
to the action level exceedance recorded at IS(Mf)9.
3.3.3.3 Monitoring
results of depth averaged suspended solid (mg/L) at IS10 and IS(Mf)11 which are
located downstream to active works during flood tide were 6.2 mg/L and 7.6 mg/L
which are below active and limit level and shows that depth averaged suspended
solid (mg/L) at downstream to active works were not adversely affected.
3.3.3.4 Turbidity
level (NTU) results recorded at IS(Mf)9 is 11.8 NTU during flood tide on 6 Sept
13 which was well below the Action and Limit Level which indicates turbidity
level was not adversely affected.
3.3.3.5 When
impact water quality monitoring was carried out during mid flood tide at
monitoring location IS(Mf)9, no discoloration of sea water was observed and no
silty plume were observed to flow from the inside to the outside of the site
boundary.
3.3.3.6 The
exceedance was likely due to local effects in the vicinity of IS(Mf)9.
3.3.3.7 The
exceedance was considered as non-Project related.
3.3.3.8 Nevertheless,
the Contractor was reminded to ensure provision of ongoing maintenance to the
silt curtains and to carry out maintenance work once defects were found.
3.3.3.9 Maintenance
work of the silt curtain was carried out by the Contractor on a daily basis
except Sunday and public holiday.
3.3.4
One (1) Action Level exceedance at measured Suspended
Solids (mg/L) where recorded on 16 September 2013 during mid-ebb tide at
monitoring station IS(Mf)6. For Action Level exceedances at measured Suspended
Solids (mg/L), 25 mg/L was recorded at Monitoring Station IS(Mf)6.

3.3.4.1 For
locations and type of active works carried out on 16 Sept 13, please refer to
the above layout map.
3.3.4.2 For
action level exceedance of depth averaged SS (in mg/L) recorded at IS(Mf)6
during mid ebb tide, Suspended solids values recorded at Impact Station IS7,
IS(Mf)9 and IS8 located downstream to and closer to active works than IS(Mf)6
during Mid-Ebb tide were below the Action and Limit Level during the same tide
on the same day. This indicates project works is unlikely to contribute to the
action level exceedance recorded at IS(Mf)6.
3.3.4.3 Same
type of works was carried out at the same locations on 13 and 18 Sept 13 but
Suspended Solids values recorded at IS(Mf)6 on 13 and 18 Sept 13 are all below
the Action and Limit Level during the same tide on the these days. Turbidity
level (NTU) results recorded at IS(Mf)9 is 11.8 NTU during flood tide on 6 Sept
13 which was well below the Action and Limit Level which indicates turbidity
level was not adversely affected.
3.3.4.4 Turbidity
measurements result at IS(Mf)6 during Ebb tide is 12.2 NTU which is well below
the Action and Limit Level. It is considered that the turbidity recorded at
IS(Mf)6 were not adversely affected by active works.
3.3.4.5 The
exceedances were likely due to local effects in the vicinity of IS(Mf)6.
3.3.4.6 The
exceedances were considered as non-Project related.
3.3.4.7 Nevertheless,
the Contractor was reminded to ensure provision of ongoing maintenance to the
silt curtains and to carry out maintenance work once defects were found.
3.3.4.8 Maintenance
work of the silt curtain was carried out by the Contractor on a daily basis
except Sunday and public holiday.
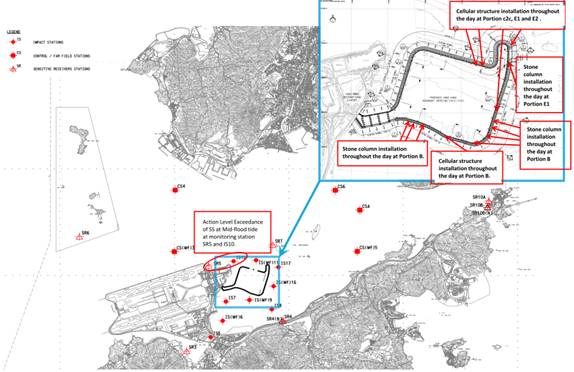
3.3.5
One (1) Action Level exceedance at measured Suspended
Solids (mg/L) where recorded on 18 September 2013 during mid-flood tide at
monitoring station SR4(N). For Action Level exceedance at measured Suspended
Solids (mg/L), 24 mg/L was recorded at Monitoring Station SR4(N)
3.3.5.1 Please
refer the above layout map for activity carried out on 18 Sept 13.
3.3.5.2 IS(Mf)9
and IS(Mf)16 are located closer to the active works than monitoring station
SR4(N). Depth Averaged Suspended Solids (SS) values (in mg/L) recorded during
the flood tide on the same day at IS(Mf)9 and IS(Mf)16 were below the Action
and Limit Level which indicates project works is unlikely to contribute to the
action level exceedance recorded at SR4(N).
3.3.5.3 The
monitoring location of monitoring station SR4(N) are considered upstream to the
active works of this project. Therefore it was unlikely that the exceedances recorded
at SR4(N) were due to active construction activities of this project.
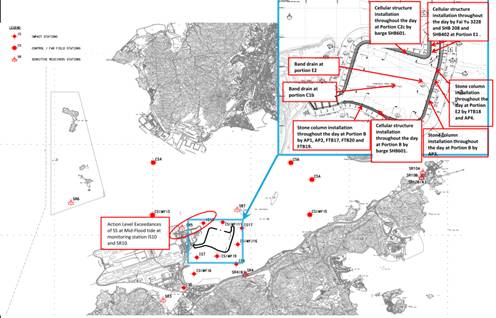
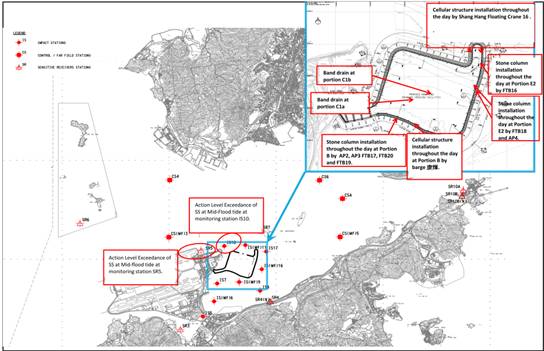
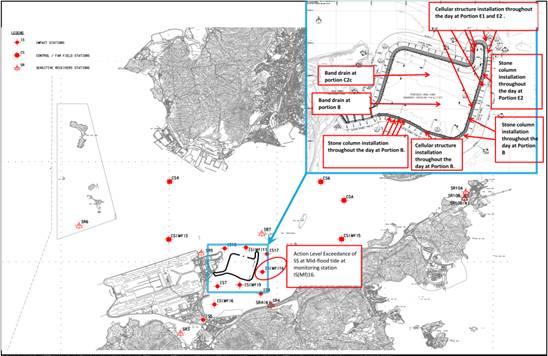
3.3.5.4 Cellular
structure installation works were conducted at Portion E2 and at Portion B by
construction vessels during mid flood tide on 18 Sept 13 but cellular structure
installation was considered unlikely to contribute to elevation of Suspended
Solids.
3.3.5.5 The
exceedance was likely due to local effects in the vicinity of SR4(N).
3.3.5.6 Nevertheless,
the Contractor was reminded to ensure provision of ongoing maintenance to the
silt curtains and to carry out maintenance work once defects were found.
3.3.5.7 Maintenance
work of the silt curtain was carried out by the Contractor on a daily basis
except Sunday and public holiday.
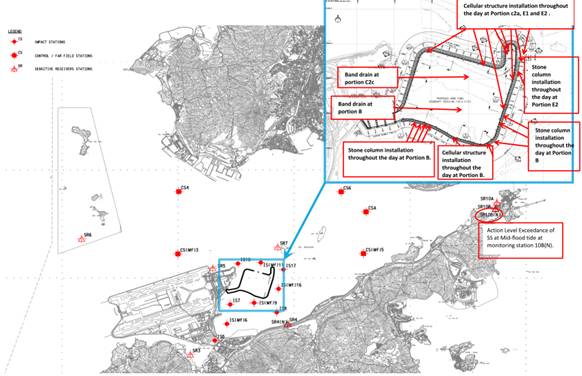
3.3.6
Two
(2) Action Level exceedance at measured Suspended Solids (mg/L) where recorded
on 30 Sept 13 during mid-flood tide at monitoring station SR5 and IS (10). For
Action Level exceedance at measured Suspended Solids (mg/L), 24.5 mg/L were
recorded at Monitoring Station SR5 and IS(10).
3.3.6.1 Please refer
the above layout map for activity carried out on 30 Sept 13.
3.3.6.2 No
active works were carried out portion C2a, Portion A and Portion C1a.
Installation of band drain was carried out at Portion C1b and Cellular
Structure installation was carried out at Portion C2c and E1 on 30 Sept 13.
These works were unlikely to generate silt plumes or suspended solid. Stone
column installation was conducted at Portion B and E2 which is far away from
IS10 and SR5. (For location of each portion please refer to below Layout -
Portion of Marine Work)
3.3.6.3 Suspended
solids values recorded at Impact Stations IS(Mf)11 and IS7 which is closer to
the active works at Portion E2 and Portion B respectively than monitoring
station IS10 and SR5 were below the action and limit level which indicates that
active works from portion E2 and B is unlikely to cause SS exceedance at
monitoring station IS10 and SR5.
3.3.6.4 Turbidity
level (NTU) results recorded at IS10 and SR5 were 14.2 NTU and 20.4 NTU
respectively during flood tide on 30 Sept 13 which was below the Action and
Limit Level which indicates turbidity level was not adversely affected.
3.3.6.5 When
impact water quality monitoring was carried out during mid flood tide at
monitoring location IS10 and SR5,
no discoloration of sea water was observed and no silty plume were observed to
flow from the inside to the outside of the site boundary.
3.3.6.6 The
exceedance was likely due to local effects in the vicinity of IS10 and SR5.
3.3.6.7 Nevertheless,
the Contractor was reminded to ensure provision of ongoing maintenance to the
silt curtains and to carry out maintenance work once defects were found.
3.3.6.8 Maintenance
work of the silt curtain was carried out by the Contractor on a daily basis
except Sunday and public holiday.
3.3.7
Two (2) Action Level exceedances at measured Suspended Solids
(mg/L) were recorded on 04 Oct 2013 at monitoring station IS(Mf) 16 and IS(Mf)9
at Mid-Ebb tide and Mid-Flood tide respectively. For Action Level exceedances
at measured Suspended Solids (mg/L), 32.9 mg/L and 25.4 mg/L was recorded at
Monitoring Station IS(Mf)16 and IS(Mf)9 respectively.
3.3.7.1 For
locations and type of active works carried out on 4 Oct 13, please refer to the
above layout map.
3.3.7.2 Impact
Stations IS10 and IS(Mf)11 are downstream and closer to the active works at
Portion E1 and E2 than monitoring station IS(Mf)9 during flood tide. Suspended
solids value recorded on 4 Oct 13 at Impact Stations IS10 and IS(Mf)11 is
9.1mg/L and 7.5mg/L during flood tide respectively which were below the action
and limit level. Hence active works from portion E1 and E2 were unlikely to
cause SS exceedance at monitoring station IS(Mf)9 during mid flood tide.
3.3.7.3 IS(Mf)9
was considered upstream to active works at Portion B during flood tide which SS
level were unlikely to be adversely affected by active works at Portion B.
3.3.7.4 Turbidity
level (NTU) result recorded on 4 Oct 13 at IS(Mf)16 during ebb tide and IS(Mf)9
during flood tide is 22.7 NTU and 22.6 NTU respectively which were below the
Action and Limit Level, this indicates turbidity level was not adversely
affected.
3.3.7.5 Same
type of works were carried out at the same location on 2 and 7 Oct 13 but
Suspended Solids values recorded at IS(Mf)16 and IS(Mf)9 on 2 and 7 Oct 13 are
all below the Action and Limit Level during the same tide on the same day which
indicates active works is unlikely to adversely affect the water quality at
IS(Mf)16 and IS(Mf)9.
3.3.7.6 When
impact water quality monitoring was carried out at IS(Mf)16 during mid ebb tide
and at IS(Mf)9 during mid flood tide, no discoloration of sea water was
observed and no silty plume were observed to flow from the inside to the
outside of the site boundary.
Photo
record shows that no defect was observed on the perimeter silt curtain nearby
IS(Mf)9.
Photo record
shows that no defect was observed on the perimeter silt curtain nearby
IS(Mf)16.
Photo
record shows that localised silt curtain was implemented during stone column
installation.
3.3.7.7 The
recorded suspended solids values recorded on 4 Oct 13 at monitoring station
IS7, IS8 & IS17 during both tide were below the action and limit level
which shows that the water quality nearby IS(Mf)16 during ebb tide and IS(Mf)9
during flood tide were not adversely affected.
3.3.7.8 The
exceedances were likely due to local effects in the vicinity of IS(Mf)16 and
IS(Mf)9.
3.3.7.9 The
exceedance was considered as non-Project related.
3.3.7.10 Nevertheless,
the Contractor was reminded to ensure provision of ongoing maintenance to the
silt curtains and to carry out maintenance work once defects were found.
3.3.7.11 Maintenance
work of the silt curtain was carried out by the Contractor on a daily basis
except Sunday and public holiday.
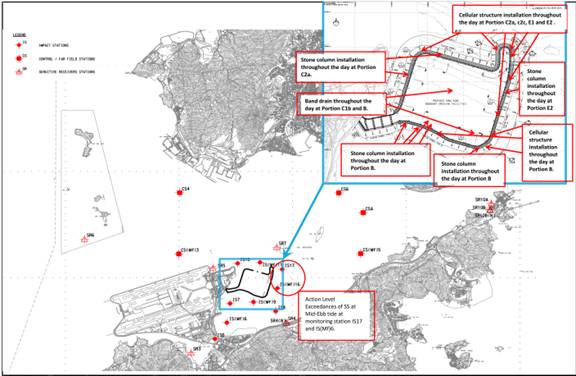
3.3.8
Two (2) Action Level exceedances at measured Suspended
Solids (mg/L) were recorded on 7 Oct 2013 during mid-flood tide at monitoring
station IS10 and SR5. For Action Level exceedances at measured Suspended Solids
(mg/L), 25 mg/L and 24.8 mg/L were recorded at Monitoring Station IS10 and SR5
respectively.
3.3.8.1 Please refer
attached Layout Map for work activity carried out on 7 Oct 13.
3.3.8.2 No
active works were carried out at portion C2a, C2c and Portion A. Installation
of band drain was carried out at Portion C1b & Portion C1a and Cellular
Structure installation was carried out at Portion E1 and C2b on 7 Oct 13. These
works were unlikely to generate silt plumes or suspended solid. Stone column
installation was conducted at Portion B, E1 and E2 which are far away from IS10
and SR5. (For location of each portion please refer to attached Layout -
Portion of Marine Work)
3.3.8.3 IS(Mf)11
and IS17 which are closer to the active works at Portion E2 than it is for
monitoring station IS10 and SR5 and the suspended solid value of IS(Mf)11 and
IS17 at mid flood tide were below the action and limit level which indicates
that active works from portion E2 were unlikely to cause SS exceedance at
monitoring station IS10 and SR5.
3.3.8.4 IS7
which is closer to the active works at portion B than it is for monitoring
station IS10 and SR5 and the suspended solids level of IS7 at mid flood tide
were below the action and limit level which indicates that active works from
portion B were unlikely to cause SS exceedance at monitoring station IS10 and
SR5.
3.3.8.5 Turbidity
level (NTU) result recorded at IS10 and SR5 is 11.7 NTU and 12.6 NTU
respectively during flood tide on 7 Oct 13 which was below the Action and Limit
Level which indicates turbidity level was not adversely affected. (Please see
attached photo record of the sea condition taken on 7 Oct 13)
3.3.8.6 When
impact water quality monitoring was carried out during mid flood tide at
monitoring location IS10 and SR5,
no silty plume were observed to flow from the inside to the outside of the site
boundary.
3.3.8.7 Strong
wind and rough sea condition were experienced during impact water quality
monitoring conducted during mid flood tide at monitoring. (Please see photo
record which shows the sea condition recorded on 7 Oct 13.)
3.3.8.8 The exceedances were likely due to local
effects in the vicinity of IS10 and SR5..
3.3.8.9 The
exceedances were considered as non-Project related.
3.3.8.10 Nevertheless,
the Contractor was reminded to ensure provision of ongoing maintenance to the
silt curtains and to carry out maintenance work once defects were found.
3.3.8.11 Maintenance
work of the silt curtain was carried out by the Contractor on a daily basis
except Sunday and public holiday.
3.3.9
One (1) Action Level exceedance at measured Suspended
Solids (mg/L) where recorded on 16 Oct 13 2013 during mid-flood tide at
monitoring station IS(Mf)16. For Action Level exceedance at measured Suspended
Solids (mg/L), 32 mg/L was recorded at Monitoring Station IS(Mf)16
3.3.10.1 Please
refer the above layout map for activity carried out on 16 Oct 13.
3.3.10.2 Impact
Stations IS10 and IS(Mf)11 are downstream and closer to the active works at Portion
E1 and E2 than monitoring station IS(Mf)16 during flood tide. Suspended solids
value recorded on 16 Oct 13 at Impact Stations IS10 and IS(Mf)11 is 4.2mg/L and
6.4mg/L during flood tide respectively. The recorded suspended solids values
are below the action and limit level which indicate that active works at
Portion E1 and E2 on 16 Oct 13 were unlikely to cause SS exceedance at
monitoring station IS(Mf)16 during mid flood tide.
3.3.10.3 IS(Mf)16
is considered upstream to active works during flood tide, therefore active
works is unlikely to cause SS exceedance at monitoring station IS(Mf)16 during
mid flood tide.
3.3.10.4 Turbidity
level (NTU) result recorded on 16 Oct 13 at IS(Mf)16 is 20.5 NTU during flood
tide which were below the Action and Limit Level, this indicates turbidity
level was not adversely affected. (Please see below photo record of the sea
condition taken on 16 Oct 13.)
Photo
record of the sea condition taken on 16 Oct 13
3.3.10.5 When
impact water quality monitoring was carried out at IS(Mf)16 during mid flood
tide, no discoloration of sea water was observed and no silty plume were
observed to flow from the inside to the outside of the site boundary.
3.3.10.6 No
defect was observed on the perimeter silt curtain during monitoring conducted
at nearby IS(Mf)16 on 16 Oct 13.
3.3.10.7 The
exceedances were likely due to local effects in the vicinity of IS(Mf)16.
3.3.10.8 The
exceedances were considered as Non-project related
3.3.10.9 Nevertheless,
the Contractor was reminded to ensure provision of ongoing maintenance to the
silt curtains and to carry out maintenance work once defects were found.
3.3.10.10 Maintenance
work of the silt curtain was carried out by the Contractor on a daily basis
except Sunday and public holiday
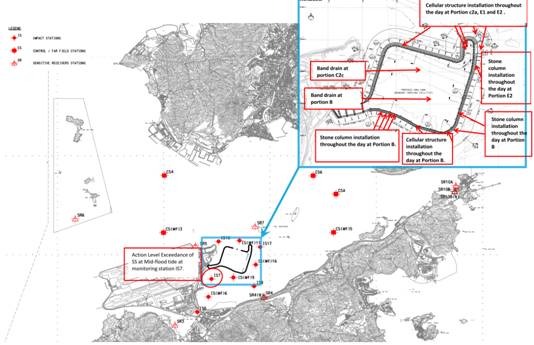
3.3.10
One (1) Action Level exceedance at measured Suspended
Solids (mg/L) was recorded on 18 Oct 2013 at monitoring station IS7 at
Mid-Flood tide. For Action Level exceedance at measured Suspended Solids (mg/L)
at IS17, 27.6 mg/L were recorded.
3.3.10.1 For
locations and type of active works carried out on 18 Oct 13, please refer to
the above layout map.
3.3.10.2 Same
type of works were carried out at the same location on 16 and 21 Oct 13 but
Suspended Solids values recorded at IS7 on 16 and 21 Oct 13 are all below the
Action and Limit Level during the same tide.
3.3.10.3 Turbidity
level (NTU) result recorded on 18 Oct 13 at IS7 is 8.7 NTU during flood tide
which was below the Action and Limit Level, this indicates turbidity level was
not adversely affected. (Please see attached photo record of the sea condition
taken on 18 Oct 13.)
3.3.10.4 When
impact water quality monitoring was carried out at IS7 during mid flood tide on
18 Oct 13, no discoloration of sea water was observed and no silty plume were
observed to flow from the inside to the outside of the site boundary.
3.3.10.5 Photo
record shows that no defect was observed on the perimeter silt curtain nearby
IS7 on 18 Oct 13.
3.3.10.6 The
exceedances were likely due to local effects in the vicinity of IS7.
3.3.10.7 The
exceedances were considered as Non-project related.
3.3.10.8 Nevertheless,
the Contractor was reminded to ensure provision of ongoing maintenance to the
silt curtains and to carry out maintenance work once defects were found.
3.3.10.9 Maintenance
work of the silt curtain was carried out by the Contractor on a daily basis
except Sunday and public holiday.
3.3.11
One (1) Action Level exceedances at measured Suspended
Solids (mg/L) were recorded on 21 Oct 2013 at monitoring station SR10B(N) at
Mid-Flood tide. For Action Level exceedance at measured Suspended Solids
(mg/L), 23.8 mg/L were recorded at Monitoring Station SR10B(N).
3.3.11.1 For locations
and type of active works carried out on 21 Oct 13, please refer to the above
layout map.
3.3.11.2 IS(Mf)11
and IS10 are located downstream and closer to the active works than monitoring
station SR10B(N) during flood tide. Depth Averaged Suspended Solids (SS) values
(in mg/L) recorded during flood
tide on the same day at IS(Mf)11 and IS10 were below the Action and Limit Level
which indicates project work is unlikely to contribute to the action level
exceedance recorded at SR10B(N).
3.3.11.3 The
monitoring location of monitoring station SR10B(N) are considered upstream and
remote to the active works of this project during flood tide. Therefore it was
unlikely that the exceedance recorded at SR10B(N) during flood tide was due to
active construction activities of this project.
3.3.11.4 The
exceedance was likely due to local effects in the vicinity of SR10B(N).
3.3.11.5 Nevertheless,
the Contractor was reminded to ensure provision of ongoing maintenance to the
silt curtains and to carry out maintenance work once defects were found.
3.3.11.6 Maintenance
work of the silt curtain was carried out by the Contractor on a daily basis
except Sunday and public holiday.
3.3.12
Two (2) Limit Level exceedances at measured Suspended
Solids (mg/L) were recorded on 25 Oct 2013 at monitoring station IS10 and SR5
at Mid-Flood tide. For Limit Level exceedance at measured Suspended Solids
(mg/L), 54.7 mg/L and 36.8 mg/L were recorded at Monitoring Station IS10 and
SR5 respectively at Mid-Flood tide.
3.3.12.1 For
locations and type of active works carried out on 25 Oct 13, please refer to
the above layout map.
3.3.12.2 No
active works were carried out portion A, C2a, C1a and C1b. Cellular Structure
installation was carried out at Portion C2c, E1, E2 and B on 25 Oct 13 and
stone column installation was conducted at Portion B and E1 which is relatively
far away from IS10 and SR5.
3.3.12.3 The
location and type of active works conducted were almost the same on 23, 25 and
28 Oct 13 at mid flood tide but no exceedance was recorded at IS10 and SR5 on
23 and 28 Oct 13. This indicates that the exceedances at monitoring station
IS10 and SR5 were unlikely to be contributed by active works.
3.3.12.4 Impact
Stations IS(Mf)11 and IS7 is located closer to the active works of Portion E2
and B respectively than monitoring station IS10 and SR5 on 25 Oct 13, suspended
solids values recorded at IS(Mf)11 and IS7 were below the action and limit
level which indicates that active works from portion C2c, E1, E2 and B were
unlikely to cause SS exceedances at monitoring station IS10 and SR5.
3.3.12.5 When
impact water quality monitoring was carried out during mid flood tide at
monitoring location IS10 and SR5, appearance of sea water was relatively turbid
than it is for other monitoring stations but no silt plume was observed to flow
from the inside to the outside of the site boundary. Hence, on-site
observations did not support that the elevated SS was due project works.
3.3.12.6 Turbidity
level (NTU) results recorded at IS10 and SR5 were 11.6 NTU and 11.8 NTU
respectively during flood tide on 25 Oct 13 which was below the Action and
Limit Level and this indicates turbidity level was not adversely affected.
3.3.12.7 No
turbid water was observed and no silt plume was observed to flow from the inside
to the outside of the site boundary when monitoring was conducted at monitoring
station IS(Mf)11 and CS(Mf)3 which is the closest monitoring station next to
IS10 and SR5 respectively.
3.3.12.8 The
exceedances were likely due to local effects in the vicinity of IS10 and SR5.
3.3.12.9 The
exceedances were considered as Non-project related
3.3.12.10 Nevertheless,
the Contractor was reminded to ensure provision of ongoing maintenance to the
silt curtains and to carry out maintenance work once defects were found.
3.3.12.11 Maintenance
work of the silt curtain was carried out by the Contractor on a daily basis
except Sunday and public holiday.
3.3.13
Two (2) Action Level exceedances at measured Suspended
Solids (mg/L) were recorded on 04 Nov 2013 at monitoring station IS(Mf) 16 and
IS17 at Mid-Ebb tide and Mid-Flood tide respectively. For Action Level
exceedances at measured Suspended Solids (mg/L), 24.3 mg/L and 31.6 mg/L were
recorded at Monitoring Station IS(Mf)16 and IS(Mf)9 respectively.
3.3.13.1 For
locations and type of active works carried out on 4 Nov 13, please refer to the
above layout map.
3.3.13.2 For
action level exceedance of suspended solid recorded at IS(Mf)16 and IS17 during
mid ebb tide, active works were carried out at almost the same locations on 1,
4 and 6 Nov 13, but all Suspended Solids results recorded at all monitoring
location on 1 and 6 Nov 13 are all below the Action and Limit Level during the
same tide on the same day which indicates active works is unlikely to adversely
affect the water quality at IS(Mf)16 and IS17
3.3.13.3 When
impact water quality monitoring was carried out during mid ebb tide at
monitoring location IS(Mf)16 and IS17on 4 Nov 13, no silty plume were observed
to flow from the inside to the outside of the site boundary.
3.3.13.4 Turbidity
level (NTU) result recorded on 4 Nov 13 at IS(Mf)16 during ebb tide and IS17
during flood tide is 17.2 NTU and 18.4 NTU respectively which were below the
Action and Limit Level, this indicates turbidity level was not adversely
affected. (Please see attached photo record of the sea condition taken on 4 Nov
13.)
3.3.13.5 Photo
record shows that no defect was observed on the perimeter silt curtain nearby
IS(Mf)16 and IS17. (Please see attached photo record)
3.3.13.6 When
impact water quality monitoring was carried out at IS(Mf)16 during mid ebb tide
and at IS(Mf)9 during mid flood tide, no discoloration of sea water was
observed and no silty plume were observed to flow from the inside to the
outside of the site boundary.
3.3.13.7 Photo
record of the sea condition taken on 4 Nov 13
Photo
record of site condition nearby IS(Mf)6
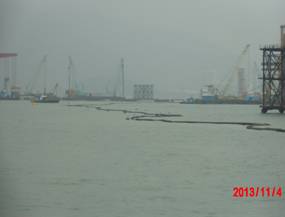
Photo
record shows site condition nearby IS17
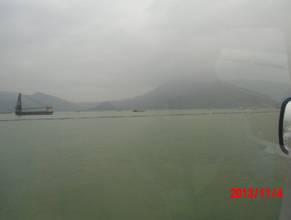
3.3.13.8 The
recorded suspended solids values recorded on 4 Nov13 at monitoring station
IS(Mf)11, IS(Mf)9 and IS(Mf)8 during ebb tide were below the action and limit level
which shows that the water quality nearby IS(Mf)16 and IS17during ebb tide were
not adversely affected.
3.3.13.9 The
exceedances were likely due to local effects in the vicinity of IS(Mf)16 and
IS17.
3.3.13.10 Nevertheless,
the Contractor was reminded to ensure provision of ongoing maintenance to the
silt curtains and to carry out maintenance work once defects were found.
3.3.13.11 Maintenance
work of the silt curtain was carried out by the Contractor on a daily basis
except Sunday and public holiday.
3.3.14
Four (4) Action Level exceedances at measured Suspended
Solids (mg/L) were recorded on 06 Nov 2013 during mid-flood tide at monitoring
station IS10 and SR5. For Action Level exceedances at measured Suspended Solids
(mg/L), 30.8 mg/L, 27.0 mg/L, 31.9 mg/L and 25.2 mg/L were recorded at
Monitoring Station IS10, SR10B(N) , SR5 and SR6 respectively.
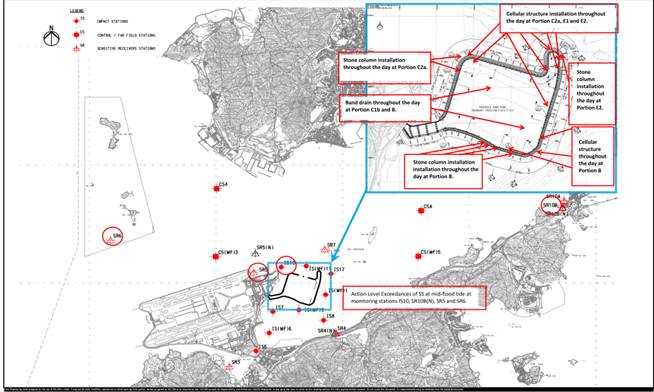
3.3.14.1 Active works like stone column and
cellular structure installation were carried out at Portion C2a, E1, E2 and B
but no exceedance was recorded at IS(Mf)11 which IS(Mf)11 is considered downstream
and closer to active works of Portion E1 and E2. No exceedance was recorded at
IS7 which IS7 is considered downstream to active works of Portion B.
3.3.14.2 Exceedances (IS10, SR5 and SR6)
recorded at stations which are considered located downstream and closest to
active works at Portion C2a during flood tide.
3.3.14.3 IS7 which is closer to the active
works at portion B than it is for monitoring station IS10 and SR5 and the
suspended solids level of IS7 at mid flood tide were below the action and limit
level which indicates that active works from portion B were unlikely to cause
SS exceedance at monitoring station IS10 and SR5.
3.3.14.4 Hence, active works like stone
column and cellular structure installation carried out at Portion E1, E2 and B
were unlikely to cause exceedance.
3.3.14.5 When monitoring was conducted, no
turbid water was observed at SR7 and IS(Mf)11, but turbid water was observed at
IS10, SR5 an SR6 which is located downstream to to active works at Portion C2a during
flood tide.
3.3.14.6 However, with refer to the silt curtain
condition on 6 and 8 Nov 13,
defects of the perimeter silt curtain was observed at southwest and northwest
of the construction site but no exceedance was observed on 8 Nov 13 at IS10,
SR5, SR6 and SR10B(N).
3.3.14.7 Almost same type and location of
works were conducted by vessels on 4, 6 and 8 Nov 13 but no exceedance was
recorded on 4 and 8 Nov 13, indicating works conducted by vessels unlikely to
cause the exceedances.
3.3.14.8 Monitoring results show no
recurrence of exceedance of SS at IS10, SR5, SR6 and SR10B(N) on 8 Nov 13
indicating the exceedance of SS at IS10, SR5, SR6 and SR10B(N) during flood
tide are unlikely due to marine work activities shown on the attached layout.
3.3.14.9 SR10B(N) is considered upstream
to active works during flood tide and no exceedance was recorded at CS6, CSA,
CS(Mf)5, IS(Mf)16 and IS7 which are closer to the HKBCF. Therefore, the
exceedance recorded at SR10B(N) is not likely to be contributed from active
work of HKBCF which is located downstream to SR10B(N).
3.3.14.10 As such, the exceedances recorded
at IS10, SR5, SR6 and SR10B(N) were considered as non-Project related.
3.3.14.11 Nevertheless, the Contractor was
reminded to ensure provision of ongoing maintenance to the silt curtains and to
carry out maintenance work once defects were found.
3.3.14.12 Maintenance work of the silt
curtain was carried out by the Contractor on a daily basis except Sunday and
public holiday.
3.3.14.13 Photo record of the sea condition taken
on 6 Nov 13
Condition
of sea and silt curtain on 6 November 2013 (the northwest side of BCF)
3.3.15
Two (2) Action Level exceedances at measured Suspended
Solids (mg/L) where recorded on 11 Nov 13 2013 during mid-flood tide and
mid-ebb tide at monitoring station IS(Mf)16. For Action Level exceedance at
measured Suspended Solids (mg/L), 27.9mg/L and 26.4mg/L was recorded at
Monitoring Station IS(Mf)16
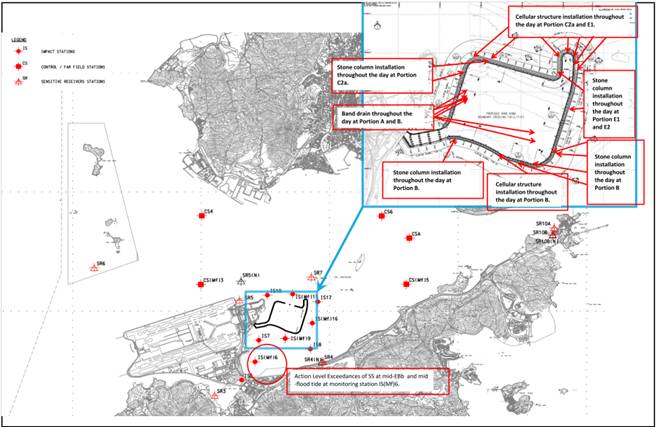
3.3.15.1 Please
refer the above layout map for activity carried out on 11 Nov 13.
3.3.15.2 Suspended
Solids values recorded at Impact Station IS(Mf)9 and IS7 which are closer to
the works than monitoring station IS(Mf)6 are all below the Action and Limit Level
during the same tide on the same day. This indicates that active works is
unlikely to cause the exceedances at IS(Mf)6.
3.3.15.3 Almost
same type and location of works were carried out at the same location on 8, 11
and 13 Nov 13 but Suspended Solids values recorded at IS(Mf)6 on 8 and 13 Nov
13 are all below the Action and Limit Level during the same tide on the same
day. This indicates that active works is unlikely to cause the exceedance at
IS(Mf)6.
3.3.15.4 Monitoring
results show no recurrence of exceedance of SS at IS(Mf)6 on 13 Nov 13
indicating the exceedances of SS at IS(Mf)6 during flood and ebb tide are
unlikely due to marine work activities shown on the attached layout map.
3.3.15.5 Localised
silt curtain was implemented during stone column installation. (Please refer to
the photo record attached)
3.3.15.6 No
defects of perimeter silt curtain was observed at the proximity of IS(Mf)6.
(Please refer to the photo record attached)
Photo
record of the sea condition taken on 11 Nov 13
Implementation
of localised silt curtain during stone column installation
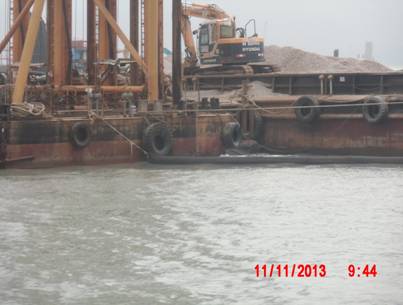
Condition
of silt curtain at near the monitoring station IS(Mf)6
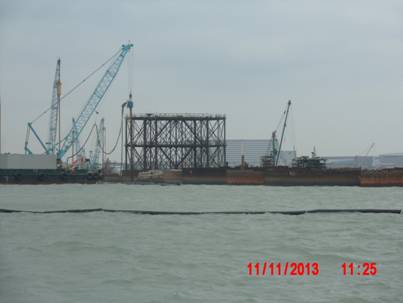
3.3.15.7 As such,
the exceedances recorded at IS(Mf)6 during both tide were considered as
non-Project related.
3.3.15.8 The
exceedance was likely due to local effects in the vicinity of IS(Mf)6.
3.3.15.9 Nevertheless,
the Contractor was reminded to ensure provision of ongoing maintenance to the
silt curtains and to carry out maintenance work once defects were found.
3.3.15.10 Maintenance
work of the silt curtain was carried out by the Contractor on a daily basis
except Sunday and public holiday.
3.3.16
One (1) Action Level exceedance at measured Suspended
Solids (mg/L) was recorded on 13 Nov 13 during mid-flood tide at monitoring
station SR4(N). For Action Level exceedance at measured Suspended Solids
(mg/L), 33.8 mg/L was recorded.
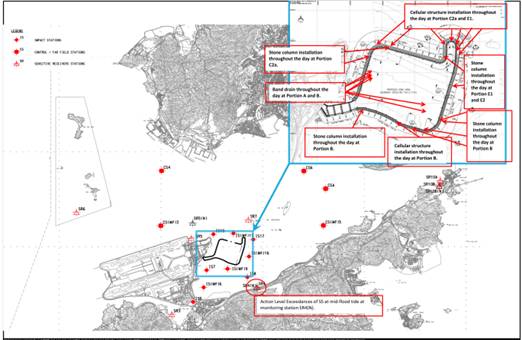
3.3.16.1 Please
refer the above layout map for activity carried out on 13 Nov13.
3.3.16.2 IS(Mf)9,
IS8 and IS(Mf)16 are located closer to the active works than monitoring station
SR4(N). Depth Averaged Suspended Solids (SS) values (in mg/L) recorded during
the flood tide on the same day at IS(Mf)9, IS8 and IS(Mf)16 were below the
Action and Limit Level which indicates project works is unlikely to contribute
to the action level exceedance recorded at SR4(N).
3.3.16.3 The monitoring
location of monitoring station SR4(N) are considered upstream to the active
works of this project during flood tide. Therefore it was unlikely that the
exceedance recorded at SR4(N) was due to active construction activities of this
project.
3.3.16.4 The
exceedance was likely due to local effects in the vicinity of SR4(N).
3.3.16.5 Nevertheless,
the Contractor was reminded to ensure provision of ongoing maintenance to the
silt curtains and to carry out maintenance work once defects were found.
3.3.16.6 Maintenance
work of the silt curtain was carried out by the Contractor on a daily basis
except Sunday and public holiday.
3.3.16.7 Photo
record of the sea condition taken on 13 Nov 13
|
Condition
of silt curtain near the monitoring station SR4(N).
|
|
|
|
|
|
|
|
|
|
|
|
|
|
|
|
|
|
|
|
|
|
|
|
|
|
|
|
|
|
|
|
|
|
|
|
|
|
|
|
|
|
|
|
|
|
|
|
|
|
|
|
|
|
|
|
|
|
|
|
|
|
|
|
|
|
|
|
|
|
|
|
|
|
|
|
|
|
|
|
|
|
|
|
|
|
|
|
|
|
|
|
|
|
|
|
|
|
|
|
|
|
|
|
|
|
|
|
|
|
|
|
|
|
|
|
|
|
|
|
|
|
|
|
|
|
|
|
|
|
|
|
|
|
|
|
|
|
|
|
|
|
|
|
|
|
|
|
|
|
|
|
|
|
|
|
|
|
|
|
|
|
|
|
|
|
|
|
|
|
|
|
|
|
|
|
|
|
|
|
|
|
|
|
|
|
|
|
|
|
|
|
|
|
|
|
|
|
|
|
|
|
|
|
|
|
|
|
|
|
|
|
|
|
3.3.17
Two (2) action level exceedance of SS was recorded on 15
Nov 13 at monitoring station IS17 during ebb tide and IS(Mf)9 during flood tide. SS level of 26 mg/L
and 26.3 mg/L were recorded for station IS17 during ebb tide and IS(Mf)9 during flood tide respectively.
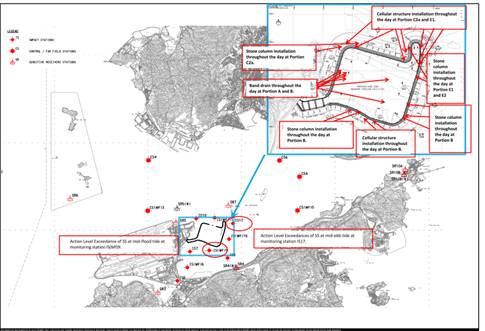
3.3.17.1 Please refer the below layout map for
activity carried out on 15 Nov 13.
3.3.17.2 Turbidity
level (NTU) results recorded on 15 Nov 13 at IS17 during ebb tide and IS(Mf)9
during flood tide is 23.4 NTU and 20.4 NTU respectively which were below the Action
and Limit Level, this indicates turbidity level was not adversely affected.
(Please see attached photo record of the sea condition taken on 15 Nov 13.)
3.3.17.3 Almost
the same type of works at the same locations were carried out at the same
location on 13, 15 and 18 Nov 13 but Suspended Solids values recorded at IS17
and IS(Mf)9 on 13 and 18 Nov 13 are all below the Action and Limit Level during
the same tide on the same day which indicates active works is unlikely to
adversely affect the water quality at IS17 and IS(Mf)9.
3.3.17.4 The
recorded suspended solids values recorded on 15 Nov 13 at monitoring station
IS(Mf)11, SR7, IS(Mf)16 during ebb tide were below the action and limit level
which shows that the water quality nearby IS17 during the monitoring period
were not adversely affected.
3.3.17.5 The
recorded suspended solids values recorded on 15 Nov 13 at monitoring station
IS(Mf)16, IS8 and IS7 during mid flood tide were below the action and limit
level which shows that the water quality nearby IS(Mf)9 during the monitoring
period were not adversely affected.
3.3.17.6 Refer to
the attached layout map, active works were noted directly upstream to IS(Mf)9
during flood tide and IS17 during ebb tide, but no defects at south aligment
(Nearby IS(Mf)9 and the northwest aligment of the perimeter silt curtain
(nearby SI17) when monitoring was conducted on 15 Nov 13.
3.3.17.7 The
exceedances were likely due to local effects in the vicinity of IS17 and
IS(Mf)9.
3.3.17.8 The
exceedances were considered as Non-project related
3.3.17.9 Nevertheless,
the Contractor was reminded to ensure provision of ongoing maintenance to the
silt curtains and to carry out maintenance work once defects were found.
3.3.17.10 Maintenance
work of the silt curtain was carried out by the Contractor on a daily basis
except Sunday and public holiday.
3.3.17.11 Photo
record of the sea condition taken on 15 Nov 13
3.3.18
Two (2) Action level exceedance of SS was recorded on 20
Nov 13 at monitoring station IS(Mf)6 and IS7 during mid flood tide. SS level of
31.5mg/L and 23.7mg/L was recorded for IS(Mf)6 and IS7 respectively.
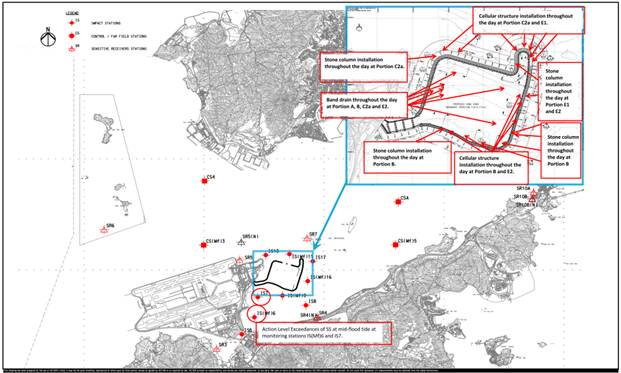
3.3.18.1 Please refer
attached Layout Maps for work activity carried out on 20 Nov 13.
3.3.18.2 Turbidity
level (NTU) results recorded on 20 Nov 13 at IS(Mf)6 and IS7 during flood tide
is 24.5 NTU and 8.7 NTU respectively which were below the Action and Limit
Level, this indicates turbidity level was not adversely affected. (Please see
attached photo record of the sea condition taken on 20 Nov 13.)
3.3.18.3 IS(Mf)9
is located closer to the active works than monitoring stations IS(Mf)6 and IS7.
Depth Averaged Suspended Solids (SS) values (in mg/L) recorded during the flood
tide on the same day at IS(Mf)9 was below the Action and Limit Level which
indicates that the water quality nearby IS(Mf)6 and IS7 during the monitoring
period were not adversely affected.
3.3.18.4 Almost
the same type of works at the same locations were carried out at the same
location on 18 and 22 Nov 13 but Suspended Solids values recorded at IS(Mf)6
and IS7 on 18 and 22 Nov 13 are all below the Action and Limit Level during the
same tide on the same day which indicates active works is unlikely to adversely
affect the water quality at IS(Mf)6 and IS7.
3.3.18.5 Refer to
the attached layout map, active works were noted directly upstream to IS(Mf)6
and IS7 during flood tide, but no defects at the northwest alignment of the
perimeter silt curtain (nearby SI(Mf)11) when monitoring was conducted on 20
Nov 13.
3.3.18.6 No
defects of perimeter silt curtain was observed at the proximity of IS(Mf)6 and
IS7. (Please refer to the photo record attached)
3.3.18.7 Condition
of silt curtain near the monitoring station IS(Mf)6 and IS7.
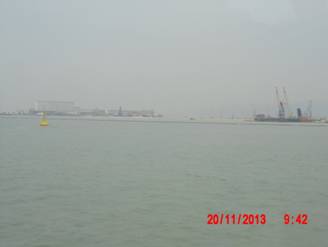
3.3.18.8 The
exceedances were likely due to local effects in the vicinity of IS(Mf)6 and
IS7.
3.3.18.9 The
exceedances were considered as Non-project related
3.3.18.10 Nevertheless, the Contractor was reminded
to ensure provision of ongoing maintenance to the silt curtains and to carry
out maintenance work once defects were found.
3.3.18.11 Maintenance work of the silt curtain was
carried out by the Contractor on a daily basis except Sunday and public holiday
3.3.19
Three (3) Action level exceedance of SS was recorded on 22
Nov 13 at monitoring station IS(Mf)6 during mid-ebb tide, IS5 and SR3 during
mid-flood tide. SS level of 30mg/L at monitoring station IS(Mf)6 during mid-ebb
tide was recorded and 24.6mg/L and 23.7mg/L were recorded for IS5 and SR3
respectively
during mid flood tide
3.3.19.1 Please
refer attached Layout Maps for work activity carried out on 22 Nov 13.
During
Mid-ebb tide:
3.3.19.2 Turbidity
level (NTU) results recorded on 22 Nov 13 at IS(Mf)16 during ebb tide is 22.5
NTU which were below the Action and Limit Level, this indicates turbidity level
was not adversely affected. (Please see attached photo record of the sea
condition taken on 22 Nov 13.)
3.3.19.3 IS17 and
IS(Mf)11 which are located closer to the active works than monitoring stations
IS(Mf)16. Depth Averaged Suspended Solids (SS) values (in mg/L) recorded during
the ebb tide on the same day at IS17 and IS(Mf)11 were below the Action and
Limit Level which indicates that the water quality nearby IS(Mf)16 during the
monitoring period were not adversely affected.
3.3.19.4 Almost
the same type of works at the same locations were carried out at the same
location on 18, 20 and 22 Nov 13 but Suspended Solids values recorded at
IS(Mf)16 on 18, 20 and 22 Nov 13 are all below the Action and Limit Level
during the same tide on the same day which indicates active works is unlikely
to adversely affect the water quality at IS(Mf)16.
3.3.19.5 Localised
silt curtain was implemented during stone column installation.
3.3.19.6 No
defects of perimeter silt curtain was observed at the proximity of IS(Mf)16.
(Please refer to the photo record attached)
During
Mid-flood tide:
3.3.19.7 Turbidity
level (NTU) results recorded on 22 Nov 13 at IS5 and SR3 during flood tide is
15.7 NTU and 18.7 NTU respectively which were below the Action and Limit Level,
this indicates turbidity level was not adversely affected. (Please see attached
photo record of the sea condition taken on 22 Nov 13.)
3.3.19.8 IS(Mf)9
and IS7 are located closer to the active works than monitoring stations IS5 and
SR3. Depth Averaged Suspended Solids (SS) values (in mg/L) recorded during the
flood tide on the same day at IS(Mf)9 and IS7 were below the Action and Limit
Level which indicates project works is unlikely to contribute to the action
level exceedance recorded at IS5 and SR3.
3.3.19.9 The
monitoring location of monitoring stations IS5 and SR3 are considered upstream
to the active works of this project during flood tide. Therefore it was
unlikely that the exceedances recorded at IS5 and SR3 were due to active
construction activities of this project.
3.3.19.10 The
exceedances were likely due to local effects in the vicinity of IS(Mf)16, IS5
and SR3.
3.3.19.11 The
exceedances were considered as Non-project related
3.3.19.12 Nevertheless,
the Contractor was reminded to ensure provision of ongoing maintenance to the
silt curtains and to carry out maintenance work once defects were found.
3.3.19.13 Maintenance work of the silt curtain was
carried out by the Contractor on a daily basis except Sunday and public holiday
3.3.20
The graphical plots of the trends of the monitoring results
are provided in Appendix G. No specific trend of the monitoring results or
existence of persistent pollution source was noted.
3.4.2
The impact dolphin monitoring conducted is vessel-based and
combines line-transect and photo-ID methodology, which have adopted similar
survey methodologies as that adopted during baseline monitoring to facilitate
comparisons between datasets.
3.4.3
The layout map of impact dolphin monitoring have been
provided by AFCD and is shown in Figure 4.
3.4.4
The effort summary and sighting details during the
reporting quarter are
shown in the Appendix H. A summary of key findings of the
dolphin surveys completed during the reporting quarter is shown below:
Table 3.6 Summary
of Key Dolphin Survey Findings in Sept 2013- Nov 2013
|
Number of Impact Surveys Completed^
|
6
|
|
Survey Distance Travelled under
Favourable On- Effort Condition
|
665.9km
|
|
Number of Sightings
|
42 sightings (28 sightings are ”on
effort” (which are all under favourable condition), 14 “sightings are
opportunistic”)
|
|
Number of dolphin individual sighted
|
133 individuals (the best estimated
group size)
|
|
Dolphin Encounter Rate#
|
NEL: 0
NWL:6.3
|
|
Dolphin Group Size
|
Average of 3.2
Varied from 1-12 individuals
|
|
Most Often frequent dolphin sighting
area
|
Sha Chau and Lung Kwu Chau Marine Park.
|
Remarks:
^ Completion of line transect survey of NEL and NWL survey
area once was counted as one complete survey.
# Dolphin Encounter Rate = (Sum of 1st 2nd, 3rd month’s total
sighting/ Sum of 1st , 2nd, 3rd month’s total effort)*100km
(encounter rates are calculated using on effort
sightings made under favourable conditions only.)
3.4.5
Two
(2) Action
Level exceedances of dolphin monitoring were recorded in the reporting quarter.
The investigation results showed that although no unacceptable changes in
environmental parameters of this project have been measured, at this time it is
not possible to make a conclusive assessment of this Project’s specific impact
on dolphins. The investigation results are annexed in Appendix L. Actions were
taken according to the Event and Action Plan for impact dolphin monitoring.
Please refer to Appendix L for details of action taken. Table 3.7 below shows
the Summary of STG and ANI encounter rates in Sept 2013- Nov 2013.
*Quarterly Average
Encounter Rate of Number of Dolphin Sightings (STG) presents averaged encounter
rates of the three monitored months in terms of groups per 100km per survey
event.
STG
Encounter rate = (Average of (total number sighting/total effort) of 1st and
2nd completed survey# of 1st month+ Average of (total number sighting/total
effort) of 1st and 2nd completed survey# of 2nd month + Average of (total
number sighting/total effort) of 1st and 2nd completed survey# of 3rd
month)/3*100km
**Quarterly
Average Encounter Rate of Total Number of Dolphins (ANI) presents averaged
encounter rates of the three monitored months in terms of individuals per 100km
per survey event.
ANI
Encounter rate = (Average of (total number of Individual/total effort) of 1st
and 2nd completed survey# of 1st month+ Average of (total number of
Individual/total effort) of 1st and 2nd completed survey# of 2nd month +
Average of (total number of Individual/total effort) of 1st and 2nd completed
survey# of 3rd month +)/3*100km
3.4.6
Details of the comparison and analysis methodology and
their findings and discussions are annexed in Appendix H.
3.4.7
Single parameter analyses are unable to detect impact as
the influence of additional and co-correlated factors are not accounted for. As
such, a multi-parameter model was proposed and reviewed by management
authorities. This analysis is currently underway and shall be reported in full
in a separate report immediately in its completion.
3.5.1 Site
Inspections were carried out on a weekly basis to monitor the implementation of
proper environmental pollution control and mitigation measures for the Project.
In the reporting quarter, 13 site
inspections were carried out. Recommendations on remedial actions were given to
the Contractors for the deficiencies identified during the site audits.
3.5.2
Particular observations during the site inspections are
described below:
Air Quality
3.5.3
Stockpile of sand was observed entire surface wet at WA2.
The Contractor was reminded that stockpile of aggregate or dusty materials
shall be sprayed with water so as to maintain the entire surface wet; or
covered entirely by impervious sheeting or placed in sheltered areas to
mitigate potential fugitive dust emission. (Reminder)
3.5.4
Side curtain attached to the tipping point of a conveyor
belt on a filling barge was provided to filling barge but was observed not
fully enclosed. The Contractor was reminded to provide a fully enclosed side
curtain for filling activities. (Reminder)
3.5.5
Sand surface was observed during inspection at works area
at Portion A. The Contractor provided dust control to the areas with sand
surface. The Contractor was reminded to continue the provision of dust control
measures to the areas with sand surface. (Reminder)
3.5.6
Dark smoke was observed emitted on barges when sand
material was being transferred to another barge. The Contractor was reminded to
rectify the situation such as to maintain their equipments in good condition to
prevent emission of dark smoke. The Contractor maintained their equipments in
good condition to prevent emission of dark smoke. (Closed)
3.5.7
Bags of cement was observed not entirely covered by
impervious sheeting, the Contractor was reminded to keep the bags of cement
covered entirely by impervious sheeting. The Contractor rectified the situation
and kept the bags of cement covered entirely by impervious sheeting. (Closed)
Noise
3.5.8
Some plants mounted on construction vessels were observed
acoustically-decoupled, but a generator was still observed not totally
acoustically-decoupled on barge Shang Ho Bo 601. The Contractor was advised to
continue to provision of enhancement works i.e. to provide sufficient acoustic
decoupling measure(s) such as acoustic mat to noisy equipments. The Contractor
was reminded that insufficient/inadequate mitigation measures must be swiftly
rectified. (Reminder)
3.5.9
A Generator was observed without sufficient decoupling
measures on barge Fai Yu 3228. The Contractor provided sufficient acoustic
decoupling measures to generator on Fai Yu 3228. (Closed)
3.5.10
Noise Emission Label (NEL) of an air compressor was
observed missing. The Contractor was reminded to properly display the NEL on
all Compressors. The Contractor properly display the NEL the Compressors
observed on Kiu Chi. (Closed)
Chinese White Dolphin
3.5.11
No adverse observation was identified in the reporting
month.
Water Quality
3.5.12
Oil drum was observed improperly stored on barge SHB401, on
rock bund, works area at Portion A, on an area outside Contractor’s site
office, the Contractor was reminded to provide mitigation measures such as
bunding or drip tray to all oil drums. The Contractor removed the oil drums
from area without bunding or drip tray. (Closed)
3.5.13
Open holes were observed within the drum of the bunding on
barge SHB401, on Barge Fai Yu 3228, on barge AP4, on barge Evershine 668, on
barge Yat Fai, at works area of portion A and on temporary rock bund. The
Contractor was reminded to provide effective mitigation measures such as to
seal the holes properly to prevent potential leakage and runoff. The Contractor
provided effective mitigation measures such as to fix the defects properly to
prevent potential leakage and runoff. (Closed)
3.5.14
It was observed that the frame of a trip tray on barge
Shang Ho Bo 601 was insufficient. The Contractor was reminded to provide
effective mitigation measures such as drip tray/bunding with sufficient height
to contain waste drums. The Contractor provided drip tray/bunding with
sufficient space to contain waste drums. (Closed)
3.5.15
It was observed that the frame of a trip tray on barge Fai
Yu 3228 was damaged. The Contractor was reminded to provide effective
mitigation measures such as drip tray with sufficient height to contain
equipments. (Closed)
3.5.16
Machine and generator were observed without drip tray/tarpaulin
sheet underneath at rock bund and works area at Portion A and on steel cell.
The Contractor was reminded to provide mitigation measures to prevent potential
surface runoff. The Contractor rectified the situation by placing tarpaulin
sheet underneath the machine and sand bag was used to surround the machine.
(Closed)
3.5.17
A new generator was observed without drip tray on cellular
structure. The Contractor was reminded to provide mitigation measures such as
drip tray to this generator before operation of this generator. (Reminder)
3.5.18
Temporary mitigation measure was provided to idle
generation on barge Fai Yu 3228 but the Contractor was reminded to provide
mitigation measures such as drip tray or bunding to prevent potential oil
leakage and surface runoff. The generator was provided with built-in drip tray.
(Closed)
3.5.19
Silt plum was observed flowed from the inside of the
localized silt curtain on barge Sun Moon Kee. The Contractor rectified the
defects of the localized silt curtain. (Closed)
3.5.20
A fuel tank which is not in use was observed without drip
tray or bunding. The Contractor was reminded to provide mitigation measures
such as drip tray or bunding to fuel tank before use. (Reminder)
3.5.21
Oil stain was observed on barge Yat Fat and on barge Kiu
Chiu. The Contractor was reminded to clear the oil stain using oil absorbent
material and dispose the absorbent as chemical waste. The Contractor cleared
the oil stain observed on barge Yat Fat. (Closed)
3.5.22
Barges were observed without sufficient enclosed side
curtain. The Contractor was reminded to provide barges for delivering sand
material with sufficient enclosed side curtain. The Contractor was reminded to
provide barges for delivering sand material with enclosed side curtain.
(Closed)
3.5.23
Turbid water was observed at the southwestern silt curtain
entrance area. Refer to the photo taken and site observations, sources of
impact likely due to the turbine activities and/or movement of vessel at
shallow water (at near the entrance at southwestern of the Construction site
and/or when vessel’s propeller was turn on at shallow water). The dispersion of
turbid water from the inside of the perimeter silt curtain to the outside of
the perimeter silt curtain is potentially due to defects of perimeter silt
curtain at certain sections and/or insufficient overlapping at entrance/exit of
the perimeter silt curtain. The Contractor was advised to regularly evaluate
the integrity of the perimeter silt curtain by reviewing the results obtained
from daily checking or/and monthly diver inspections specified by the Silt
Curtain Deployment Plan. The Contractor was advised to provide sufficient
mitigation measures and swiftly carry out maintenance once defects of the
perimeter silt curtain are found during the above mentioned daily checking
and/or monthly diver inspection. The Contractor was provided mitigation
measures and carried out maintenance above mentioned defects of the perimeter
silt curtain are found. (Closed)
Chemical and Waste Management
Waste
3.5.24
Bags of waste were observed accumulated on barge Four Sea 8, barge
Hing Fai, barge AP4 and various locations on a works area at Portion A. The
Contractor was reminded to clear the waste regularly to prevent accumulation.
(Reminder)
3.5.25
Litter and general refuse was observed accumulated on sea
the Contractor was reminded to avoid/clear any foam, oil, grease, chemicals,
litter, food or other objectionable matter due to the Project works presented
in the water within and adjacent to the works site. The Contractor avoided any
foam, oil, grease, chemicals, litter, food or other objectionable matter due to
the Project works presented in the water within and adjacent to the works site.
The Contractor was reminded to collect and clear the waste on sea regularly.
(Closed)
3.5.26
General refuse were found on various location of the works
area at Portion A. The Contractor was reminded to clear the general refuse
regularly. The Contractor was reminded to maintain the site in a clean and tidy
condition i.e. to properly store the general refuse at designated waste storage
area(s). The Contractor cleared the general maintain the site in a clean and
tidy condition. (Closed)
Landscape and Visual Impact
3.5.27
No relevant works was carried out in the reporting Quarter.
Others
3.5.28
The Contractor was reminded to properly display relevant
Environmental Permit at an appropriate location i.e. near entrance on barge Kam
Shun 368, so that it may be easily noticed. (Reminder)
3.5.29
Water was observed accumulate inside car tyre on barge Yat
Fat. The Contractor was reminded to keep the site clean and tidy and clear the
water accumulated inside car to prevent mosquito breeding. The Contractor
rectified the situation by clearing the car tyre on barge Yat Fat. (Closed)
3.5.30
The Contractor had rectified most of the observations as
identified during environmental site inspection in the reporting Quarter.
Rectifications of remaining identified items are undergoing by the Contractor.
Follow-up inspections on the status on provision of mitigation measures will be
conducted to ensure all identified items are mitigated properly.
3.5.31
The Contractor had rectified most of the observations as
identified during environmental site inspection in the reporting Quarter.
Rectifications of remaining identified items are undergoing by the Contractor.
Follow-up inspections on the status on provision of mitigation measures will be
conducted to ensure all identified items are mitigated properly.
4
Advice on the Solid and
Liquid Waste Management Status
4.1.1
The Contractor registered as a chemical waste producer for
this project. Sufficient numbers of receptacles were available for general
refuse collection and sorting.
4.1.2
As advised by the Contractor, 2,162,636.3 m3 of fill
were imported for the Project use in the reporting period. 1.792 tonnes of
paper/ carboard packaging and 1.4 tonnes of metal were generated, 1.2 tonnes of
chemical waste and 78 m3 of general refuse were generated and
disposed of in the reporting period. Monthly summary of waste flow table is
detailed in Appendix M.
4.1.3
The Contractor is advised to properly maintain on site
C&D materials and wastes collection, sorting and recording system, dispose
of C&D materials and wastes at designated ground and maximize reuse /
recycle of C&D materials and wastes. The Contractor is reminded to properly
maintain the site tidiness and dispose of the wastes accumulated on site
regularly and properly.
4.1.4
The Contractor is reminded that chemical waste containers
should be properly treated and stored temporarily in designated chemical waste
storage area on site in accordance with the Code of Practice on the Packaging,
Labelling and Storage of Chemical Wastes.
5.1.1
In response to the site audit findings, the Contractors
carried out corrective actions.
5.1.2
A summary of the Implementation Schedule of Environmental
Mitigation Measures (EMIS) is presented in Appendix C. Most of the recommended
mitigation measures are being upheld. Moreover, regular review and checking on
the construction methodologies, working processes and plants were carried out
to ensure the environmental impacts were kept minimal and recommended environmental
mitigation measures were implemented effectively.
5.1.3
Training of marine travel route for marine vessels operator
was given to relevant staff and relevant records were kept properly.
5.1.4
Regarding the implementation of dolphin monitoring and
protection measures (i.e. implementation of Dolphin Watching Plan, Dolphin
Exclusion Zone and Silt Curtain integrity Check), regular checks were conducted
by experienced MMOs within the works area to ensure that no dolphins were
trapped by the silt curtain area. There were no dolphins spotted within the
silt curtain during this quarter. The relevant procedures were followed and all
measures were well implemented. The silt curtains were also inspected in
accordance to the submitted plan.
6
Summary of Exceedances of the
Environmental Quality Performance Limit
6.1.1
All 1-Hour TSP results were below the Action and Limit
Level in the reporting Quarter. Five
(5) 24-hour TSP results recorded at AMS3A exceeded the Action Level and one (1)
24-hour TSP results recorded at AMS3A exceeded the Limit Level in the reporting
Quarter.
Investigation results show that the exceedances were not related to Project.
6.1.2
For construction noise, no exceedance was recorded at all
monitoring stations in the reporting period.
6.1.3
Twenty eight (28) Action Level Exceedances were recorded at
measured suspended solids (SS) values (in mg/L) in the reporting Quarter. (2)
Limit Level exceedances were recorded at measured suspended solids (SS) values
(in mg/L) in the reporting quarter. Investigation results show that the
exceedances were not related to Project.
6.1.4
Two (2) Action Level exceedances were recorded in the
reporting quarter. The investigation results showed that although no
unacceptable changes in environmental parameters of this project have been
measured, at this time it is not possible to make a conclusive assessment of
this Project’s specific impact on dolphins.
6.1.5
Event and Action Plan for Impact Dolphin Monitoring was
triggered. For detail of investigation, please refer to appendix L.
6.1.6
Cumulative statistics on exceedances is provided in
Appendix J.
7
Summary of Complaints,
Notification of Summons and Successful Prosecutions
7.1.1
The Environmental Complaint Handling Procedure is annexed
in Figure 5.
7.1.2
One (1) complaint was logged by the Contractor regarding
the leakage from work barges causing water pollution near Tuen Mun Richland
Garden received on 26 Sept 13.
7.1.2.1 The
complaint reported in the EM&A report (Sept 13) regarding the leakage from
work barges causing water pollution near Tuen Mun Richland Garden was followed
up and replied by Highway Department to Oriental Daily Newspaper and it is
noted that all project related vessels (including sand barges) are designated
with a regular marine travel route to the site, but the regular travel route
plan of this project does not specify the travel route passing through the Tuen
Mun Butterfly Beach area. Information shown that all sand barges will not
conduct sand filling activities at area outside HKBCF site boundary and all
vessels have regular maintenance to ensure that all Sand Barge functioning
well.
7.1.2.2 With
refer to the available information such as photo record of the incident cannot
indicate that the leakage from work barges was caused by the vessel of this
Contract and the complaint could not be concluded as project related.
7.1.2.3 The
Contractor was advised to ensure the regular travel routes for all project
related vessels (including sand barges) shall be strictly followed, all sand
barges do not conduct sand filling activities at area outside HKBCF site
boundary and all vessels have regular maintenance to ensure that all Sand Barge
functioning well.
7.1.3
As informed by the Contractor on 5 Nov 13, 1 (one) a noise
complaint received on 14 Sept 13 was referred to the Contractor of HKBCF on 1
Nov 13. The captioned complaint involves noise generated by a tug boat
operating near a pier at Tung Chung around 05:55am-06:45am on 14 Sept 13.
7.1.3.1 In
respect of the concern incident, the Contractor of HKBCF confirmed that the tug
boat showed in photographs provided does not belong to this project. Site daily records were provided by the
Contractor and the site daily records show that no tug boat was in operation
before 09:00 on 14 Sept 13. As a result, the noise complaint was considered as
non-project related
7.1.3.2 The
Contractor was advised to notice all captains of the boats of this Contract to
be aware of the captioned noise incident and to avoid the occurrence of the
captioned situation.
7.1.4
One (1) complaint received from Penta-Ocean – Gitanes Joint
Venture (CV/2012/03) mentioned that the formation works of the Contaminated Mud
Pit CMP1 to the South of the Brothers (CMP1 of SB) which has been completed in
mid-August 2013 and the pit has been commissioned for receiving contaminated
marine mud from other projects starting from 16 August 2013. However, it was recently observed that
some of the project vessels of HY/2010/02 had berthed within the said pit and
those anchorages would likely cause disruption to the underlying contaminated
mud and thus induce unfavourable contamination impact to the surrounding marine
environment. In this regard, they reminded the contractor to avoid berthing of
their vessels within the boundary of CMP1 of SB thereafter for the sake of
environmental concern.
7.1.4.1 With
refer to the given photo, there are no sufficient details or features could be
found on the anchored vessels that confirmed they are project vessels (lack of
names and vessel number); it cannot be conclude that the concerned vessels
shown in the photos belong to this Contract. The complaint is therefore
considered not likely to be related to the construction works.
7.1.4.2 The
Contractor was advised to notice all captains of the boats of this Contract to
be aware of the captioned incident and to avoid the anchoring of vessels within
the concerned area. Further to the
captioned complaint on 22/11/2013, The Contractor had followed up with the case
about their vessels berthing within the boundary of CMP1 of SB thereafter,
causing disruption to the underlying contaminated mud and induces contamination
impact to the surrounding marine environment. In respect of the concern
situation, all captains of the vessels were reminded to avoid anchor in the
captioned area immediately.
7.1.5
One (1) follow up enquiry of the same issue mentioned in a
complaint reported in the EM&A report (Sept 13) was logged by the Contractor
on 9 Oct 2013. The enquirer expressed concern of the leakage from work barges
causing water pollution at sea near Tuen Mun Richland Garden and the impact of
fishery activities.
7.1.5.1
The complaint reported in the EM&A report (Sept 13)
regarding the leakage from work barges causing water pollution near Tuen Mun
Richland Garden was followed up and information shown that all project related
vessels (including sand barges) are designated with a regular marine travel
route to the site, but the regular travel route plan of this project does not
specify the travel route passing through the Tuen Mun Butterfly Beach area.
7.1.5.2
Information
shown that all sand barges will not conduct sand filling activities at area outside
HKBCF site boundary and all vessels have regular maintenance to ensure that all
Sand Barge functioning well.
7.1.5.3
Although with refer to the available information such as
photo record of the incident cannot indicate that the leakage from work barges
was caused by the vessel of this Contract and the complaint could not be
concluded as project related.
7.1.5.4
The Contractor was advised to ensure the regular travel
routes for all project related vessels (including sand barges) shall be
strictly followed, all sand barges do not conduct sand filling activities at
area outside HKBCF site boundary and all vessels have regular maintenance to
ensure that all Sand Barge functioning well.
7.1.6
No notification of summons and successful prosecution was
received in the reporting period.
7.1.8
Statistics on complaints, notifications of summons and
successful prosecutions are summarized in Appendix J.
8.1
Comments on mitigation
measures
8.1.1
According
to the environmental site inspections performed in the reporting quarter, the
following recommendations were provided:
Air
Quality Impact
l All working
plants and vessels on site should be regularly inspected and properly
maintained to avoid dark smoke emission.
l All vehicles should be washed to
remove any dusty materials before leaving the site.
l Haul roads should be sufficiently
dampened to minimize fugitive dust generation.
l Wheel washing facilities should
be properly maintained and reviewed to ensure properly functioning.
l Temporary exposed slopes and open
stockpiles should be properly covered.
l Enclosure should be erected for
cement debagging, batching and mixing operations.
l Water spraying should be provided to suppress fugitive dust for any dusty
construction activity.
Construction
Noise Impact
l Quieter powered mechanical
equipment should be used as far as possible.
l Noisy operations should be oriented
to a direction away from sensitive receivers as far as possible.
l Proper and effective noise
control measures for operating equipment and machinery on-site should be
provided, such as erection of movable noise barriers or enclosure for noisy
plants. Closely check and replace the sound insulation materials regularly
l Vessels and equipment operating
should be checked regularly and properly maintained.
l Noise Emission Label (NEL) shall be
affixed to the air compressor and hand-held breaker operating within works
area.
l Better scheduling of construction
works to minimize noise nuisance.
l Acoustic decoupling measures
should be properly implemented for all existing and incoming construction vessels
with continuous and regularly checking to ensure effective implementation of
acoustic decoupling measures.
Water
Quality Impact
l Regular review and maintenance of
silt curtain systems, drainage systems and desilting facilities in order to
make sure they are functioning effectively.
l Construction of seawall should be
completed as early as possible.
l Regular inspect and review the
loading process from barges to avoid splashing of material.
l Silt, debris and leaves
accumulated at public drains, wheel washing bays and perimeter u-channels and
desilting facilities should be cleaned up regularly.
l Silty effluent should be treated/
desilted before discharged. Untreated effluent should be prevented from
entering public drain channel.
l Proper drainage channels/bunds
should be provided at the site boundaries to collect/intercept the surface
run-off from works areas.
l Exposed slopes and stockpiles
should be covered up properly during rainstorm.
Chemical
and Waste Management
l All types of wastes, both on land
and floating in the sea, should be collected and sorted properly and disposed
of timely and properly. They should be properly stored in designated areas
within works areas temporarily.
l All chemical containers and oil
drums should be properly stored and labelled.
l All plants and vehicles on site
should be properly maintained to prevent oil leakage.
l All kinds of maintenance works
should be carried out within roofed, paved and confined areas.
l All drain holes of the drip trays
utilized within works areas should be properly plugged to avoid any oil and
chemical waste leakage.
l Oil stains on soil surface and
empty chemical containers should be cleared and disposed of as chemical waste.
l Regular review should be
conducted for working barges and patrol boats to ensure sufficient measures and
spill control kits were provided on working barges and patrol boats to avoid
any spreading of leaked oil/chemicals.
Landscape
and Visual Impact
l All existing,
retained/transplanted trees at the works areas should be properly fenced off and
regularly inspected.
8.2
Recommendations on EM&A Programme
8.2.1
The impact monitoring programme for air quality, noise,
water quality and dolphin ensured that any deterioration in environmental
condition was readily detected and timely actions taken to rectify any
non-compliance. Assessment and analysis of monitoring results collected
demonstrated the environmental impacts of the Project. With implementation of
recommended effective environmental mitigation measures, the Project’s
environmental impacts were considered as environmentally acceptable. The weekly
environmental site inspections ensured that all the environmental mitigation
measures recommended were effectively implemented.
8.2.2
The recommended environmental mitigation measures, as
included in the EM&A programme, effectively minimize the potential
environmental impacts from the Project. Also, the EM&A programme
effectively monitored the environmental impacts from the construction
activities and ensure the proper implementation of mitigation measures. No
particular recommendation was advised for the improvement of the programme.
8.3
Conclusions
8.3.1
The construction phase and EM&A programme of the
Project commenced on 12 March 2012.
8.3.2
All
1-Hour TSP results were below the Action and Limit Level in the reporting
quarter. Five (5) 24-hour TSP results recorded at AMS3A exceeded the Action
Level and one (1) 24-hour TSP results recorded at AMS3A exceeded the Limit
Level in the reporting quarter. Investigation results show that the exceedances
were not related to Project.
8.3.3
For construction noise, no exceedance was recorded at all
monitoring stations in the reporting period.
8.3.4
Twenty
eight (28) Action Level Exceedances were recorded at measured suspended solids
(SS) values (in mg/L) in the reporting quarter. (2) Limit Level exceedances
were recorded at measured suspended solids (SS) values (in mg/L) in the
reporting quarter.
8.3.5
Two
(2) Action Level exceedances of dolphin monitoring were recorded in the
reporting quarter. The investigation results showed that although no unacceptable
changes in environmental parameters of this project have been measured, at this
time it is not possible to make a conclusive assessment of this Project’s
specific impact on dolphins.
8.3.6
Environmental
site inspection was carried out thirteen times in the reporting quarter.
Recommendations on remedial actions were given to the Contractors for the
deficiencies identified during the site audits.
8.3.7
One
(1) complaint was logged by the Contractor regarding the leakage from work
barges causing water pollution near Tuen Mun Richland Garden received on 26
Sept 13. With refer to the available information such as photo record of the
incident cannot indicate that the leakage from work barges was caused by the
vessel of this Contract and the complaint could not be concluded as project
related.
8.3.8
As
informed by the Contractor on 5 Nov 13, one (1) noise complaint received on 14
Sept 13 was referred to the Contractor of HKBCF on 1 Nov 13. After
investigation, the noise complaint was considered as non-project related.
8.3.9
One
(1) complaint received from Penta-Ocean – Gitanes Joint Venture (CV/2012/03)
mentioned that the formation works of the Contaminated Mud Pit CMP1 to the
South of the Brothers (CMP1 of SB) which has been completed in mid-August 2013
and the pit has been commissioned for receiving contaminated marine mud from
other projects starting from 16 August 2013. However, it was recently observed that
some of the project vessels of HY/2010/02 had berthed within the said pit and
those anchorages would likely cause disruption to the underlying contaminated
mud and thus induce unfavourable contamination impact to the surrounding marine
environment. In this regard, they reminded the contractor to avoid berthing of
their vessels within the boundary of CMP1 of SB thereafter for the sake of
environmental concern. After
investigation, the complaint is considered not likely to be related to the
construction works.
8.3.10
One
(1) follow up enquiry of the same issue mentioned in a complaint reported in
the EM&A report (Sept 13) was logged by the Contractor on 9 Oct 2013. The
enquirer expressed concern of the leakage from work barges causing water
pollution at sea near Tuen Mun Richland Garden and the impact of fishery
activities. Although with refer to the available information such as photo
record of the incident cannot indicate that the leakage from work barges was
caused by the vessel of this Contract and the complaint could not be concluded
as project related.
8.3.11
No
notification of summons and successful prosecution was received in the reporting
period.
8.3.12
Apart
from the above mentioned monitoring, most of the recommended mitigation
measures, as included in the EM&A programme, were implemented properly in
the reporting quarter.
8.3.13
The
recommended environmental mitigation measures effectively minimize the
potential environmental impacts from the Project. The EM&A programme
effectively monitored the environmental impacts from the construction
activities and ensure the proper implementation of mitigation measures. No
particular recommendation was advised for the improvement of the programme.
8.3.14
Moreover,
regular review and checking on the construction methodologies, working
processes and plants were carried out to ensure the environmental impacts were
kept minimal and recommended environmental mitigation measures were implemented
effectively.