
Executive Summary
1.1 Background
1.2 Scope of Report
1.3 Organization Structure
1.4 Summary of Construction Works
1.5 Summary of EM&A Programme Requirements
2.1 Air Quality
2.2 Noise Monitoring
2.3 Water Quality Monitoring
2.4 Dolphin Monitoring
2.5 EM&A Site Inspection
2.6 Waste Management Status
2.7 Environmental Licenses and Permits
2.8 Implementation Status of Environmental Mitigation Measures
2.9 Summary of Exceedances of the Environmental Quality Performance Limit
2.10 Summary of Complaints, Notification of Summons and Successful Prosecutions
3 Comparison of EM&A Results with EIA Predictions and Baseline Monitoring Results
3.1 Air Quality Monitoring
3.2 Noise Impact Monitoring
3.3 Water Quality Monitoring
3.4 Marine Ecology
3.5 Waste Management
3.6 Summary of Monitoring Methodology and Effectiveness
3.7 Summary of Mitigation Measures
4.1 Key Issues for the coming period
5 Conclusion and Recommendations
List of Appendices
Appendix A Project Organization for Environmental Works
Appendix B Implementation Schedule of Environmental Mitigation Measures (EMIS)
Appendix C Summary of Action and Limit Levels
Appendix D Impact Air Quality Monitoring Result in Graphical Presentation
Appendix E Impact Noise Monitoring Results in Graphical Presentation
Appendix F Impact Water Quality Monitoring Results in Graphical Presentation
Appendix G Impact Dolphin Monitoring Survey Results
Appendix H Event Action Plan
Appendix I Summary of Waste Flow Table
Executive
Summary
Under Contract No. HY/2012/07, Gammon Construction Limited (GCL) is commissioned by the Highways Department (HyD) to undertake the design and construction of the Southern Connection Viaduct Section of the Tuen Mun – Chek Lap Kok Link Project (TM-CLK Link Project) while AECOM Asia Company Limited was appointed by HyD as the Supervising Officer. For implementation of the environmental monitoring and audit (EM&A) programme under the Contract, ERM-Hong Kong, Limited (ERM) has been appointed as the Environmental Team (ET). Ramboll Hong Kong Ltd. was employed by the HyD as the Independent Environmental Checker (IEC) and Environmental Project Office (ENPO) in accordance with Environmental Permit No. EP-354/2009/A. Further applications for variation of environmental permit (VEP), EP-354/2009/B, EP-354/2009/C and EP-354/2009/D, were granted on 28 January 2014, 10 December 2014 and 13 March 2015, respectively.
The southern landfall of TM-CLK Link lies alongside the Hong Kong - Zhuhai - Macao Bridge Hong Kong Boundary Crossing Facilities (HKBCF) where a reclamation area is constructed by Contract No. HY/2010/02 under Environmental Permit No. EP-353/2009/K and EP-354/2009/D. Upon the agreement and confirmation between the Supervising Officer Representatives and Contractors of HY/2010/02 and HY/2012/07 in September 2015, part of the reclamation area for southern landfall under EP-353/2009/K and EP-354/2009/D was handed-over to Contract No. HY/2012/07. Another part of the southern landfall area under EP-354/2009/D was handed-over to Contract No. HY/2012/07 after completion of reclamation works by Contract No. HY/2010/02 in June 2016.
The construction phase of the Contract commenced on 31 October 2013 and will be tentatively completed by 2019. The impact monitoring of the EM&A programme, including air quality, noise, water quality and marine ecological monitoring as well as environmental site inspections, commenced on 31 October 2013.
This is the Fifth Annual EM&A Report presenting the EM&A works carried out during the period from 1 November 2017 to 31 October 2018 for the Southern Connection Viaduct Section in accordance with the Updated EM&A Manual of the TM-CLK Link Project. As informed by the Contractor, major activities in the reporting period included:
Marine-based Works
· Uninstallation of marine piling platform;
Land-based Works
· Pier construction;
· Re-alignment of Cheung Tung Road;
· Road works along North Lantau Highway;
· Launching gantry operation;
· Installation of pier head and deck segments;
· Asphalt paving;
· Construction of sign gantries, light poles and street furniture;
· Parapet and barriers installation; and
· Slope work of Viaducts A, B, C & D.
A summary of monitoring and audit activities conducted in the reporting period is listed below:
24-hour TSP monitoring 70 sessions at ASR8A
70 sessions at ASR9
1-hour TSP monitoring 70 sessions at ASR8A
70 sessions at ASR9
Noise monitoring 70 sessions at NSR1A
Water quality monitoring 150 sessions
Dolphin monitoring 24 sessions
Joint Environmental site inspection 51 sessions
Breaches of Action and Limit Levels for Air Quality
One (1) Limit Level of 1-hour TSP was recorded for air quality monitoring in the reporting period.
Breaches of Action and Limit Levels for Noise
No exceedance of Action and Limit Levels was recorded for construction noise monitoring in the reporting period.
Breaches of Action and Limit Levels for Water Quality
Eighty-six (86) Action Level and eight (8) Limit Level of Dissolved Oxygen (DO) exceedances, nine (9) Action Level and one (1) Limit Level of Suspended Solids (SS) exceedance and one (1) Action Level of Turbidity exceedance were recorded for water quality impact monitoring in the reporting period.
Impact Dolphin Monitoring
Two (2) Action Level and three (3) Limit Level exceedances for both NEL and NWL regions were recorded for four (4) sets of quarterly dolphin monitoring data between November 2017 and October 2018. No unacceptable impact from the construction activities of the TM-CLKL Southern Connection Viaduct Section on Indo-Pacific humpback dolphin Sousa chinensis (i.e. Chinese White Dolphin) was noticeable from general observations during the dolphin monitoring in this reporting period.
Daily marine mammal exclusion zone monitoring was undertaken during the period of marine works under this Contract. No Passive Acoustic Monitoring (PAM) was implemented as the marine piling works were not carried out outside the daylight hours in this reporting period. No sighting of the Chinese White Dolphin was recorded in the monitoring period during the exclusion zone monitoring.
Environmental Complaints, Non-compliance & Summons
There were four (4) complaints received from EPD / 1823 in the reporting period. Complaints included construction dust nuisance at Hong Kong Boundary Crossing (HKBCF) of Hong Kong-Zhuhai-Macau Bridge Projects, a suspected sighting of dolphin near the viaduct at Tai Ho Wan and construction materials failing from the nearby elevated structures on 29 January 2018, discharge of muddy water nearby HKBCF on 13 June 2018 and construction noise nuisance nearby the Kowloon-boundary lane of the North Lantau Highway on 16 June 2018. Upon investigation, there were no adequate evidences to conclude that the complaint cases were related to this Contract.
There was no notification of summons or successful prosecution recorded in the reporting period.
Reporting Change
There was no reporting change in this reporting period.
Future Key Issues
Potential environmental impacts arising from the upcoming construction activities in the coming annual period are mainly associated with air quality, noise, marine water quality, marine ecology and waste management issue.
1
Introduction
1.1
Background
According to the findings of the Northwest New Territories (NWNT) Traffic and Infrastructure Review conducted by the Transport Department, Tuen Mun Road, Ting Kau Bridge, Lantau Link and North Lantau Highway would be operating beyond capacity after 2016. This forecast has been based on the estimated increase in cross boundary traffic, developments in the Northwest New Territories (NWNT), and possible developments in North Lantau, including the Airport developments, the Lantau Logistics Park (LLP) and the Hong Kong – Zhuhai – Macao Bridge (HZMB). In order to cope with the anticipated traffic demand, two new road sections between NWNT and North Lantau – Tuen Mun – Chek Lap Kok Link (TM-CLKL) and Tuen Mun Western Bypass (TMWB) are proposed.
An Environmental Impact Assessment (EIA) of TM-CLKL (the Project) was prepared in accordance with the EIA Study Brief (No. ESB-175/2007) and the Technical Memorandum of the Environmental Impact Assessment Process (EIAO-TM). The EIA Report was submitted under the Environmental Impact Assessment Ordinance (EIAO) in August 2009. Subsequent to the approval of the EIA Report (EIAO Register Number: AEIAR-146/2009), an Environmental Permit (EP-354/2009) for TM-CLKL was granted by the Director of Environmental Protection (DEP) on 4 November 2009, and EP variation (EP-354/2009/A) was issued on 8 December 2010.
Under Contract No. HY/2012/07, Gammon Construction Limited (GCL) is commissioned by the Highways Department (HyD) to undertake the design and construction of the Southern Connection Viaduct Section of TM-CLKL (“the Contract”) while AECOM Asia Company Limited was appointed by HyD as the Supervising Officer. For implementation of the environmental monitoring and audit (EM&A) programme under the Contract, ERM-Hong Kong, Limited (ERM) has been appointed as the Environmental Team (ET). Ramboll Hong Kong Ltd. was employed by HyD as the Independent Environmental Checker (IEC) and Environmental Project Office (ENPO) in accordance with Environmental Permit No. EP-354/2009/A. Further applications for variation of environmental permit (VEP), EP-354/2009/B, EP-354/2009/C and EP-354/2009/D, were granted on 28 January 2014, 10 December 2014 and 13 March 2015, respectively.
The southern landfall of TM-CLK Link lies alongside the Hong Kong - Zhuhai - Macao Bridge Hong Kong Boundary Crossing Facilities (HKBCF) where a reclamation area is constructed by Contract No. HY/2010/02 under Environmental Permit No. EP-353/2009/K and EP-354/2009/D. Upon the agreement and confirmation between the Supervising Officer Representatives and Contractors of HY/2010/02 and HY/2012/07 in September 2015, part of the reclamation area for southern landfall under EP-353/2009/K and EP-354/2009/D was handed-over to Contract No. HY/2012/07. Another part of the southern landfall area under EP-354/2009/D was handed-over to Contract No. HY/2012/07 after completion of reclamation works by Contract No. HY/2010/02 in June 2016.
The construction phase of the Contract commenced on 31 October 2013 and will be tentatively be completed by 2019. The impact monitoring phase of the EM&A programme, including air quality, noise, water quality and marine ecological monitoring as well environmental site inspections, commenced on 31 October 2013.
The general layout plan of the Contract components is presented in Figures 1.1 & 1.2a to l.
1.2
Scope of This Report
This is the Fifth Annual EM&A Report under the Contract No. HY/2012/07 Tuen Mun – Chek Lap Kok Link – Southern Connection Viaduct Section. This report presents a summary of the environmental monitoring and audit works from 1 November 2017 to 31 October 2018.
1.3
Organization Structure
The organization structure of the Contract is shown in Appendix A. The key personnel contact names and contact details are summarized in Table 1.1 below.
Table 1.1 Contact Information of Key Personnel
|
Party |
Position |
Name |
Telephone |
Fax |
|
HyD (Highways Department) |
Project Coordinator |
Stanley Chan |
2762 3406 |
3188 6614 |
|
|
Senior Engineer |
Steven Shum
|
2762 4133 |
3188 6614 |
|
SOR (AECOM Asia Company Limited)
|
Chief Resident Engineer |
Daniel Ip |
3553 3800 |
2492 2057 |
|
|
Resident Engineer
|
Kingman Chan |
3691 3950 |
3691 2899 |
|
ENPO / IEC (Ramboll Hong Kong Ltd.) |
ENPO Leader
|
Y.H. Hui |
3465 2850 |
3465 2899 |
|
IEC
|
Dr. F.C. Tsang |
3465 2851 |
3465 2899 |
|
|
Contractor (Gammon Construction Limited) |
Environmental Manager
|
Brian Kam |
3520 0387 |
3520 0486 |
|
Environmental Officer
|
Roy Leung |
3520 0387 |
3520 0486 |
|
|
|
24-hour Complaint Hotline
|
|
9738 4332 |
|
|
ET (ERM-HK) |
ET Leader |
Jovy
Tam (November 2017 to 7
August 2018)/ Dr. Jasmine Ng (8 August 2018 onwards) |
2271 3113/2271 3311 |
2723 5660 |
1.4
Summary of Construction Works
As informed by the Contractor, details of the major works carried out in this reporting period are listed below:
Marine-based Works
· Uninstallation of marine piling platform;
Land-based Works
· Pier construction;
· Re-alignment of Cheung Tung Road;
· Road works along North Lantau Highway;
· Launching gantry operation;
· Installation of pier head and deck segments;
· Asphalt paving;
· Construction of sign gantries, light poles and street furniture;
· Parapet and barriers installation; and
· Slope work of Viaducts A, B, C & D.
The locations of the construction activities are shown in Figure 1.3. The Environmental Sensitive Receivers in the vicinity of the Project are shown in Figure 1.4.
The environmental mitigation measures implementation schedule is presented in Appendix B.
|
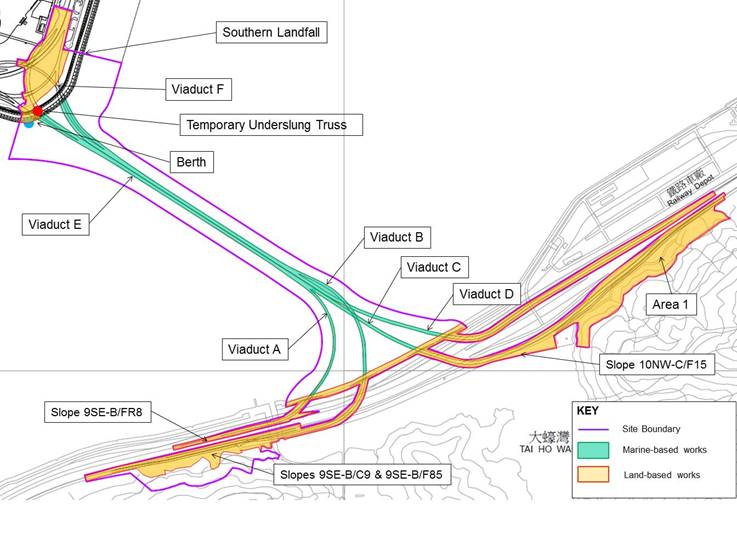
Figure 1.3 Locations of Construction Activities in the Reporting Period
1.5
Summary of EM&A Programme
Requirements
The EM&A programme required environmental monitoring for air quality, noise, water quality and marine ecology as well as environmental site inspections for air quality, noise, water quality, waste management, marine ecology and landscape and visual impacts. The EM&A requirements and related findings for each component are described in the following sections, which include:
· Monitoring parameters;
· Action and Limit levels for all environmental parameters;
· Event Action Plan;
· Tested environmental impact hypotheses;
· Environmental mitigation measures, as recommended in the approved EIA Report; and
· Environmental requirement in contract documents.
2
EM&A RESULTS
The EM&A programme required environmental monitoring for air quality, noise, water quality and marine ecology as well as environmental site inspections for air quality, noise, water quality, waste management, marine ecology and landscape and visual impacts. The EM&A requirements and related findings for each component are summarized in the following sections.
2.1
Air Quality
The baseline air quality monitoring undertaken by the Hong Kong – Zhuhai –Macao Bridge Hong Kong Projects (HZMB) during October 2011 included the two monitoring stations ASR9A and ASR9C for this Project. Thus, the baseline monitoring results and Action/ Limit Level presented in HZMB Baseline Monitoring Report ([1]) are adopted for this Project.
2.1.1
Monitoring Requirements and Equipment
In accordance with the Updated EM&A Manual, impact 1-hour TSP monitoring was conducted three (3) times in every six (6) days and impact 24-hour TSP monitoring was carried out once in every six (6) days when the highest dust impact was expected.
1-hour TSP and 24-hour TSP monitoring were conducted at two
alternative air quality monitoring stations, ASR8A (Area 4) and ASR9 (Entrance
of MTR Depot) during the reporting period in accordance with the requirement
stipulated in the Updated EM&A Manual. Details of the monitoring
stations are provided in Figure 2.1 and Table
2.1.
High Volume Samplers (HVSs) were installed at two alternative air quality monitoring stations for carrying out 1-hour and 24-hour TSP monitoring in the reporting period. The wind sensor was installed at ASR8A (Area 4) for logging wind speed and wind direction in the reporting period. Details of the equipment deployed in air quality monitoring are provided in Table 2.2.
Table 2.1 Locations of Impact Air Quality Monitoring Stations and Monitoring Dates in this Reporting Period
|
Monitoring Station (1) |
Monitoring Period (2) |
Location |
Description |
Parameters & Frequency |
|
ASR8A |
From 1 November 2017 to 31 October 2018 |
Area 4 |
On ground at the Area 4 |
Ÿ 1-hour Total Suspended Particulates (1-hour TSP, µg/m3), 3 times per day every 6 days Ÿ 24-hour Total Suspended Particulates (24-hour TSP, µg/m3), daily for 24-hour every 6 days |
|
|
|
|
|
|
|
ASR9 |
From 1 November 2017 to 31 October 2018 |
Entrance of MTRC Depot |
On ground at the entrance |
Note:
(1) Air Quality Monitoring Stations ASR9A and ASR9C at Siu Ho Wan MTRC Depot proposed in accordance with the Updated EM&A were relocated to ASR9 and ASR8A respectively.
(2) Changes in monitoring schedule are provided in Section 2.1.3.
Table 2.2 Air Quality Monitoring Equipment
|
Equipment |
Brand and Model |
|
High Volume Sampler |
Tisch Environmental Mass Flow Controlled Total Suspended Particulate (TSP) High Volume Sampler (Model No. TE-5170)
|
|
Wind Sensor |
Global Water (Wind Speed Sensor: WE550; Wind Direction Sensor: WE570)
|
|
Wind Anemometer for calibration |
Lutron (Model No. AM-4201) |
2.1.2
Action & Limit Levels
The Action and Limit Levels of the air quality monitoring are provided in Appendix C. The Event Action Plan is presented in Appendix H.
2.1.3
Monitoring Schedule for the Reporting Period
The schedules for air quality monitoring in the reporting period were presented in the approved Forty-ninth to Sixtieth Monthly EM&A Reports.
2.1.4
Results and Observations
The major dust sources in the reporting period included construction activities under the Contract as well as nearby traffic emissions.
A total of 70 monitoring events for 1-TSP and 24-hour TSP were undertaken at ASR8A and ASR9 in the reporting period. One (1) Limit Level of 1-hour TSP was recorded for air quality monitoring in the reporting period. However, there was no Action nor Limit Level exceedance was recorded for 24-hour TSP monitoring. Actions were taken in accordance with the Event Action Plan as presented in Appendix H. Detailed investigation reports on exceedances were presented in Appendix N of Forty-ninth to sixtieth Monthly EM&A Reports.
The impact monitoring results for 1-hour TSP and 24-hour TSP in the reporting period are summarized in Tables 2.3 and 2.4, respectively. Baseline and impact monitoring are presented graphically in Appendix D. The detailed impact monitoring data and meteorological information were reported in the Forty-ninth to Sixtieth Monthly EM&A Reports.
Table 2.3 Summary of 1-hour TSP Monitoring Results in this Reporting Period
|
Month |
Station |
Average (µg/m3) |
Range (µg/m3) |
Action Level (µg/m3) |
Limit Level (µg/m3) |
|
Nov 2017 |
ASR 8A |
82 |
33-165 |
394 |
500 |
|
ASR 9 |
83 |
35-148 |
393 |
500 |
|
|
Dec 2017 |
ASR 8A |
90 |
31-149 |
394 |
500 |
|
ASR 9 |
90 |
41-180 |
393 |
500 |
|
|
Jan 2018 |
ASR 8A |
80 |
13-294 |
394 |
500 |
|
ASR 9 |
93 |
16-263 |
393 |
500 |
|
|
Feb 2018 |
ASR 8A |
100 |
21-183 |
394 |
500 |
|
ASR 9 |
141 |
42-680 |
393 |
500 |
|
|
Mar 2018 |
ASR 8A |
62 |
13-137 |
394 |
500 |
|
ASR 9 |
108 |
20-261 |
393 |
500 |
|
|
Apr 2018 |
ASR 8A |
86 |
41-152 |
394 |
500 |
|
|
ASR 9 |
116 |
56-199 |
393 |
500 |
|
May 2018 |
ASR 8A |
86 |
14-236 |
394 |
500 |
|
|
ASR 9 |
86 |
14-200 |
393 |
500 |
|
Jun 2018 |
ASR 8A |
62 |
23-135 |
394 |
500 |
|
ASR 9 |
72 |
13-103 |
393 |
500 |
|
|
Jul 2018 |
ASR 8A |
48 |
19-78 |
394 |
500 |
|
ASR 9 |
53 |
17-108 |
393 |
500 |
|
|
Aug 2018 |
ASR 8A |
72 |
23-162 |
394 |
500 |
|
ASR 9 |
77 |
38-180 |
393 |
500 |
|
|
Sept 2018 |
ASR 8A |
90 |
28-346 |
394 |
500 |
|
ASR 9 |
63 |
31-97 |
393 |
500 |
|
|
Oct 2018 |
ASR 8A |
104 |
61-212 |
394 |
500 |
|
ASR 9 |
101 |
66-148 |
393 |
500 |
|
|
|
|||||
Table 2.4 Summary of 24-hour TSP Monitoring Results in this Reporting Period
|
Month |
Station |
Average (µg/m3) |
Range (µg/m3) |
Action Level (µg/m3) |
Limit Level (µg/m3) |
|
|
Nov 2017 |
ASR 8A |
64 |
30-109 |
178 |
260 |
|
|
ASR 9 |
59 |
35-92 |
178 |
260 |
||
|
Dec 2017 |
ASR 8A |
86 |
38-151 |
178 |
260 |
|
|
ASR 9 |
95 |
45-172 |
178 |
260 |
||
|
Jan 2018 |
ASR 8A |
74 |
41-131 |
178 |
260 |
|
|
ASR 9 |
75 |
42-150 |
178 |
260 |
||
|
Feb 2018 |
ASR 8A |
65 |
38-95 |
178 |
260 |
|
|
ASR 9 |
75 |
48-102 |
178 |
260 |
||
|
Mar 2018 |
ASR 8A |
57 |
35-86 |
178 |
260 |
|
|
ASR 9 |
65 |
47-100 |
178 |
260 |
||
|
Apr 2018 |
ASR 8A |
57 |
49-72 |
178 |
260 |
|
|
ASR 9 |
64 |
39-88 |
178 |
260 |
||
|
May 2018 |
ASR 8A |
35 |
10-65 |
178 |
260 |
|
|
ASR 9 |
46 |
25-75 |
178 |
260 |
||
|
Jun 2018 |
ASR 8A |
30 |
24-39 |
178 |
260 |
|
|
ASR 9 |
31 |
16-44 |
178 |
260 |
||
|
Jul 2018 |
ASR 8A |
28 |
18-32 |
178 |
260 |
|
|
ASR 9 |
31 |
21-44 |
178 |
260 |
||
|
Aug 2018 |
ASR 8A |
39 |
19-66 |
178 |
260 |
|
|
ASR 9 |
42 |
20-70 |
178 |
260 |
||
|
Sept 2018 |
ASR 8A |
70 |
21-100 |
178 |
260 |
|
|
ASR 9 |
51 |
28-83 |
178 |
260 |
||
|
Oct 2018 |
ASR 8A |
75 |
54-110 |
178 |
260 |
|
|
ASR 9 |
78 |
64-100 |
178 |
260 |
||
|
|
||||||
As shown in Table 2.5, the annual-averaged 1-hour TSP and 24-hour TSP levels in the reporting period were lower than the corresponding average baseline levels at all monitoring stations.
In order to determine any significant air quality impacts caused by construction activities from this Contract, One-way ANOVA (with α set at 0.05) was conducted to examine any significant difference in average TSP levels between the impact monitoring in this reporting period and the baseline monitoring before commencement of construction activities. The annual-averaged levels of TSP level are presented in Table 2.5 and the statistical results are presented in Table 2.6. For 1-hour TSP at ASR8A and ASR9 and 24-hour TSP at ASR8A, the TSP levels in the reporting period were significantly lower than the baseline levels. However, there were no significant difference between the TSP levels in the reporting period and the baseline levels, although the average values of TSP levels recorded in the reporting period is lower than the average baseline values.
Table 2.5 Summary of Average Levels of TSP Level of Baseline Monitoring and Reporting Period (in µg/m3)
|
Monitoring Station (1) |
Average Baseline Monitoring |
Average Impact Monitoring |
|
ASR9 (1-hour TSP) |
220 |
90 |
|
ASR9 (24-hour TSP) |
74 |
57 |
|
ASR8A (1-hour TSP) |
222 |
80 |
|
ASR8A (24-hour TSP) |
74 |
59 |
|
Note: (1) Baseline monitoring results of ASR9A and ASR9C are applied to ASR8A and ASR9 respectively. |
||
Table 2.6 One-way ANOVA Results for annual-averaged level of TSP level Comparison between Impact and Baseline Periods
|
Monitoring Station |
F ratio |
p-value |
|
ASR9 (1-hour TSP) |
F 1,250 = 114 |
<0.01 |
|
ASR9 (24-hour TSP) |
F 1,81 = 8 |
<0.05 |
|
ASR8A (1-hour TSP) |
F 1,250 = 284 |
<0.01 |
|
ASR8A (24-hour TSP) |
F 1,81 = 20 |
0.07 |
Note:
By setting α at 0.05, p-values < 0.05 (significant difference) are bold.
In addition, linear regression was conducted to examine any relationship between TSP levels and time during this yearly monitoring period at each monitoring station. Linear regression analysis makes assumptions of equal variance and normal distribution of data. Therefore, the significance level of the test was set at 1 % (i.e. p = 0.01) to reduce the chance of committing a Type 1 error. If a significant regression relationship was found between TSP level and time (i.e. p < 0.01), r2 value from the analysis would be further assessed. This value represents the proportion of the total variation in the dependent variable (i.e. TSP level) that is accounted for by the fitted regression line and is referred to as the coefficient of determination. An r2 value of 1 indicates a perfect relationship (or fit) whereas a value of 0 indicates that there is no relationship (or no fit) between the dependent and independent variables. As there are no specific criteria to indicate how meaningful an r2 value is, for the purposes of this EM&A programme a value of 0.60 was adopted to indicate a meaningful regression. If r2 < 0.60 then it was considered that there was a weak relationship between TSP level and time or none at all. If the regression analysis indicated r2 > 0.60 then it had been interpreted that there was in fact a strong relationship between the dependent and independent variables (i.e. a strong temporal trend of increasing / decreasing TSP level with time).
As shown in Table 2.7, results of the regression analysis indicated that there was no significant relationship between TSP level and time during this yearly monitoring period. As such, it is considered that there is no apparent trend of increasing / decreasing TSP level in this monitoring period.
Table 2.7 Linear Regression Result of TSP Monitoring
|
Parameter |
Station |
R2 |
F-ratio |
p-value |
Intercept |
Coefficient |
|
1-hour TSP |
ASR8A |
<0.001 |
0.012 |
<0.001 |
178 |
-0.010 |
|
ASR9 |
0.021 |
4.47 |
<0.001 |
115 |
-0.144 |
|
|
24-hour TSP |
ASR8A |
0.049 |
3.48 |
<0.001 |
76 |
-0.322 |
|
ASR9 |
0.087 |
6.49 |
<0.001 |
85 |
-0.431 |
|
|
Note: 1. Dependent variable is set as TSP levels (in µg/m3) and independent variable is set as number of day of construction works. 2. R2 values of insignificant regression model are underlined. |
||||||
2.2
Noise Monitoring
The baseline noise monitoring undertaken by the HZMB Projects during the period of 18 October to 1 November 2011 included the monitoring station NSR1 for this Project. Thus, the baseline monitoring results and Action/ Limit Level presented in HZMB Baseline Monitoring Report ([2]) are adopted for this Project.
2.2.1
Monitoring Requirements and Equipment
In accordance with the Updated EM&A Manual, impact noise monitoring was conducted once per week during the construction phase of the Contract.
Noise monitoring was conducted at the alternative noise monitoring station, NSR1A (Pak Mong Village Pavilion) during the reporting period in accordance with the requirement stipulated in the Updated EM&A Manual. Details of the monitoring stations are provided in Figure 2.2 and Table 2.8.
Noise monitoring was performed by sound level meter in compliance with the International Electrotechnical Commission Publications (IEC) 651:1979 (Type 1) and 804:1985 (Type 1) specifications at the designated monitoring station. Details of the equipment deployed in noise monitoring are provided in Table 2.9.
Table 2.8 Location of Impact Noise Monitoring Station and Monitoring Dates in this Reporting Period
|
Monitoring Station (1) |
Monitoring Period |
Location |
Parameters & Frequency |
|
NSR1A |
From 1 November 2017 to 31 October 2018 |
Entrance of Pak Mong Village |
Ÿ 30-mins measurement at each monitoring station between 0700 and 1900 on normal weekdays (Monday to Saturday). Leq, L10 and L90 would be recorded.
Ÿ At least once a week |
|
Note: (1) Noise Monitoring Station NSR1 at Pak Mong Village proposed in accordance with the Updated EM&A was relocated to NSR1A. |
|||
Table 2.9 Noise Monitoring Equipment
|
Equipment |
Brand and Model |
|
Integrated Sound Level Meter |
Rion NL-31 / NL-52
|
|
Acoustic Calibrator |
Rion NC-73 |
2.2.2
Action and Limit Levels
The Action and Limit levels of the noise monitoring are provided in Appendix C. The Event Action Plan is presented in Appendix H.
2.2.3
Monitoring Schedule for the Reporting Period
The schedules for noise monitoring in the reporting period are provided in the Forty-ninth to Sixtieth Monthly EM&A Reports.
2.2.4
Results and Observations
Major noise sources during the noise monitoring included construction activities, adjacent maintenance works, and nearby traffic noise and aircraft noise.
A total of seventy (70) monitoring events were undertaken in the reporting period with no Action Level and Limit Level exceedance recorded at the monitoring stations in the reporting period, thus no action was required to be taken in accordance with the Event Action Plan.
The impact monitoring results for noise monitoring in the reporting period are summarized in Table 2.10. Baseline and impact monitoring are presented graphically in Appendix E. The detailed impact monitoring data was reported in the Thirty-seventh to Forty-eighth Monthly EM&A Reports.
Table 2.10 Summary of Construction Noise Monitoring Results at NSR1A in the Reporting Period
|
Month |
Average , dB(A), Leq (30mins) |
Range, dB(A), Leq (30mins) |
Limit Level, dB(A), Leq (30mins) |
|
Nov 2017 |
63 |
62-64 |
75 |
|
Dec 2017 |
63 |
61-64 |
75 |
|
Jan 2018 |
63 |
62-64 |
75 |
|
Feb 2018 |
63 |
62-64 |
75 |
|
Mar 2018 |
64 |
63-65 |
75 |
|
Apr 2018 |
64 |
62-65 |
75 |
|
May 2018 |
63 |
62-64 |
75 |
|
Jun 2018 |
64 |
62-69 |
75 |
|
Jul 2018 |
64 |
62-65 |
75 |
|
Aug 2018 |
64 |
63-66 |
75 |
|
Sep 2018 |
65 |
62-67 |
75 |
|
Oct 2018 |
65 |
63-70 |
75 |
|
Note: Noise Monitoring Station NSR1 was relocated to NSR1A since December 2014. |
|||
As shown in Table 2.11, the annual-averaged noise level in the reporting period was higher than the average baseline levels at the monitoring station.
In order to determine any significant noise impacts caused by construction activities from this Contract, One-way ANOVA (with α set at 0.05) was conducted to examine any significant difference in average noise levels between the impact monitoring in this reporting period and the baseline monitoring before commencement of construction activities. The statistical results are presented in Tables 2.12. Difference in noise level between reporting and baseline monitoring periods was significant, in which the annual-averaged noise level in the reporting period was higher than average baseline level. However, all monitoring results in the reporting period complied with the Action/Limit Levels. In general, noise levels recorded in the reporting period were mostly comparable to the results obtained during the baseline monitoring period. No specific trend of the noise monitoring results or existence of persistent noise impact from the Contract during the impact monitoring period was noticeable. The ET will keep track on the future noise monitoring results during construction phase.
Table 2.11 Summary of Average Levels of Noise Level of Baseline Monitoring and Reporting Period (in dB(A))
|
Monitoring Station |
Average Baseline Monitoring |
Average Impact Monitoring |
|
NSR1A |
56 |
64 |
Table 2.12 One-way ANOVA Results for Annual-averaged Level of Noise Level Comparison between Impact and Baseline Periods
|
Monitoring Station |
F ratio |
p-value |
|
NSR1A |
F 1,356 = 669 |
<0.01 |
Note:
By setting α at 0.05, p-values < 0.05 (significant difference) are bold.
In addition, linear regression was conducted to examine any relationship between noise levels and time during this yearly monitoring period at the designated noise monitoring station. The method of data interpretation followed the same method as indicated in Section 2.1.4 for TSP monitoring. As shown in Table 2.13, results of the regression analysis indicated that there was no significant relationship between noise level and time during this yearly monitoring period. As such, it is considered that there is no apparent trend of increasing / decreasing noise level during this yearly monitoring period.
Table 2.13 Linear Regression Result of Noise Monitoring
|
Parameter |
Station |
R2 |
F-ratio |
p-value |
Intercept |
Coefficient |
|
Leq 30min |
NSR1A |
0.188 |
15.7 |
<0.001 |
53 |
0.006 |
|
Note: 1. Dependent variable is set as Leq 30min (in dB(A)) and independent variable is set as number of day of construction works. 2. R2 values of insignificant regression model are underlined. |
||||||
2.3
Water Quality Monitoring
The baseline water quality monitoring undertaken by the HZMB Projects between 6 and 31 October 2011 included all monitoring stations except SR4a for the Project. Thus, the baseline monitoring results except for station SR4a and Action/Limit Level presented in HZMB Baseline Monitoring Report ([3]) are adopted for this Project. Baseline water quality monitoring was conducted at station SR4a from 29 August to 24 September 2013.
2.3.1
Monitoring Requirements and Equipment
Impact water quality monitoring was carried out to ensure that any deterioration of water quality was detected, and that timely action could be taken to rectify the situation. Impact water quality monitoring was undertaken three days per week during mid-ebb and mid-flood tides in the construction period at seven water quality monitoring stations in accordance with the Updated EM&A Manual. Details of monitoring stations are provided in Figure 2.3 and Table 2.14.
The locations of the monitoring stations under the Contract and those covered by Contract No. HY/2010/02 are shown in Figure 2.3 and Table 2.14.
Table 2.14 Locations of Water Quality Monitoring Stations and the Corresponding Monitoring Requirements
|
Station ID |
Type |
Coordinates |
*Parameters, unit |
Depth |
Frequency |
|
|
|
|
|
Easting |
Northing |
|
|
|
|
|
IS(Mf)9 |
Impact Station (Close to HKBCF construction site)
|
813273 |
818850 |
Ÿ Temperature(°C) Ÿ pH(pH unit) Ÿ Turbidity (NTU) Ÿ Water depth (m) Ÿ Salinity (ppt) Ÿ Dissolved Oxygen (DO) (mg/L and % of saturation) · Suspended Solid (SS) (mg/L) |
3 water depths: 1m below sea surface, mid-depth and 1m above sea bed. If the water depth is less than 3m, mid-depth sampling only. If water depth less than 6m, mid-depth may be omitted. |
Impact monitoring: 3 days per week, at mid-flood and mid-ebb tides during the construction period of the Contract. |
|
|
IS(Mf)16 |
Impact Station (Close to HKBCF construction site)
|
814328 |
819497 |
|
|||
|
IS8 |
Impact Station(Close to HKBCF construction site)
|
814251 |
818412 |
|
|||
|
SR4 |
Sensitive receiver (Tai Ho Inlet)
|
814760 |
817867 |
|
|||
|
SR4a |
Sensitive receiver
|
815247 |
818067 |
|
|||
|
SR4(N) |
Sensitive receiver (Tai Ho)
|
814705 |
817859 |
|
|||
|
CS(Mf)3 |
Control Station
|
809989 |
821117 |
|
|||
|
CS(Mf)3(N)
|
Control Station
|
808814 |
822355 |
|
|||
|
CS(Mf)5 |
Control Station |
817990 |
821129 |
|
|||
|
Notes: In addition to the parameters presented monitoring location/position, time, water depth, sampling depth, tidal stages, weather conditions and any special phenomena or works underway nearby were also recorded. Water Quality Monitoring Station CS(Mf)3 was relocated to CS(Mf)3(N) since 2 May 2017. Water Quality Monitoring Station SR4 was relocated to SR4(N) since 2 March 2018. |
|||||||
Details of the equipment deployed in water quality monitoring are provided in Table 2.15.
Table 2.15 Water Quality Monitoring Equipment
|
Equipment |
Brand and Model |
|
DO, Temperature meter and Salinity |
YSI Pro2030
|
|
Turbidimeter |
HACH Model 2100Q
|
|
pH meter |
Thermo Scientific Orion 2 Star / HANNA HI8314
|
|
Positioning Equipment |
Koden913MK2 with KBG-3 DGPS antenna / Furuno GP-170
|
|
Water Depth Detector |
Speedtech Instrument SM-5 / Lowrance Mark 5x / Garmin Striker 4
|
|
Water Sampler
|
Kemmerer 1520 (1520-C25) 2.2L with messenger / WildCo Vertical Alpha Bottles 1120-2.2L /1120-3.2L Aquatic Research Instrument Vertical/Horizontal Point Water Sampler 2.2L / 3.0L
|
|
Multi-parameters (Dissolved Oxygen, Salinity, Turbidity, Temperature, pH) |
YSI ProDSS / YSI 6920 V2 Sonde
|
2.3.2
Action & Limit Levels
The Action and Limit Levels of the water quality monitoring are provided in Appendix C. The Event Action Plan is presented in Appendix H.
2.3.3
Monitoring Schedule for the Reporting Period
The schedules for water quality monitoring in the reporting period are provided in the Forty-ninth to Sixtieth Monthly EM&A Reports ([4]). Water quality monitoring at monitoring stations, IS(Mf)9 and CS(Mf)3(N), at mid-flood tide and all monitoring stations at mid-ebb tide on 8 January 2018 was cancelled due to adverse weather. Water quality monitoring during mid-flood tide at all water quality monitoring stations, except CS(Mf)5, on 5 March 2018 was cancelled due to adverse weather. Water quality monitoring during mid-flood tide at all water quality monitoring stations, on 6 June 2018 and 18 July 2018, except CS(Mf)5 on 6 June and all monitoring stations during both mid-ebb and mid-flood tide on 8 June 2018 were cancelled due to adverse weather. Water quality monitoring during mid-ebb tide on 12 September 2018 and during both mid-ebb and mid-flood tides on 17 September 2018 were cancelled due to adverse weather. Water quality monitoring on 17 and 19 February, 18 June and 1 and 17 October 2018 were cancelled due to suspension of marine works during holidays.
2.3.4
Results and Observations
Impact water quality monitoring was conducted at all designated monitoring stations in the reporting period. The detailed impact water quality monitoring data was reported in the Forty-ninth to sixtieth Monthly EM&A Reports.
In this reporting period, a total of 150 monitoring events were undertaken. Eighty –six (86) Action Level and eight (8) Limit Level of Dissolved Oxygen (DO) exceedances, nine (9) Action Level and one (1) Limit Level of Suspended Solids (SS) exceedances and one (1) Action Level of Turbidity exceedance were recorded for water quality impact monitoring in the reporting period. Actions were taken in accordance with the Event Action Plan as presented in Appendix H. Detailed investigation reports on exceedances were presented in Appendix N of Forty-ninth to sixtieth Monthly EM&A Reports.
In order to determine any significant water quality impacts caused by construction activities from this Contract, One-way ANOVA (with α set at 0.05) was conducted to examine any significant difference in average DO, Turbidity and SS levels between the impact monitoring in this reporting period and the baseline monitoring before commencement of construction activities. The annual-averaged levels of DO, Turbidity and SS are presented in Tables 2.16 to 2.18 and the statistical results are presented in Tables 2.19 to 2.21. Baseline and impact monitoring results are presented graphically in Appendix F.
In the reporting period, most annual-averaged DO levels during both mid-ebb and mid-flood tides at all depth of the impact monitoring stations were higher than corresponding average baseline levels, except the bottom DO levels at mid-flood at IS(Mf)16, IS(Mf)9, IS8 and SR4/SR4(N) were lower or the same (see Table 2.16 and 2.19). The annual depth-averaged turbidity level (see Table 2.17 and 2.20) and annual-averaged SS levels (see Table 2.18 and 2.21) recorded during the reporting period were comparable or lower than the results obtained during the baseline monitoring period. In general, DO, turbidity and SS levels were varied across sampling months (see Appendix F) and these variations were, however, not consistent throughout the reporting period. The graphical plots of the trends of the monitoring results suggested that there was no specific trend in the overall water quality monitoring.
Table 2.16 Summary of Annual Means of DO Level of Baseline Monitoring and Reporting Period (in mg/L)
|
Tide |
Station |
Depth |
Annual mean of DO of baseline monitoring |
Annual mean of DO of reporting period |
|
Mid-ebb |
IS(Mf)16 |
Surface |
6.3 |
7.0 |
|
IS(Mf)9 |
Surface |
6.6 |
7.4 |
|
|
IS8 |
Surface |
6.4 |
7.3 |
|
|
SR4/ SR4(N) |
Surface |
6.1 |
7.0 |
|
|
SR4a |
Surface |
5.5 |
6.9 |
|
|
Mid-flood |
IS(Mf)16 |
Surface |
6.3 |
7.1 |
|
IS(Mf)9 |
Surface |
6.5 |
7.0 |
|
|
IS8 |
Surface |
6.4 |
7.1 |
|
|
SR4/ SR4(N) |
Surface |
6.3 |
7.0 |
|
|
SR4a |
Surface |
5.5 |
7.0 |
|
|
Mid-ebb |
IS(Mf)16 |
Middle |
6.3 |
6.9 |
|
|
IS(Mf)9 |
Middle |
- |
7.2 |
|
Mid-flood |
IS(Mf)16 IS(Mf)9 |
Middle Middle |
6.1 6.2 |
6.5 7.6 |
|
|
IS8 |
Middle |
- |
7.4 |
|
|
SR4/ SR4(N) |
Middle |
- |
5.1 |
|
Mid-ebb |
IS(Mf)16 |
Bottom |
5.9 |
6.6 |
|
IS(Mf)9 |
Bottom |
6.6 |
7.2 |
|
|
IS8 |
Bottom |
6.2 |
6.9 |
|
|
SR4/ SR4(N) |
Bottom |
6.0 |
6.8 |
|
|
SR4a |
Bottom |
5.3 |
6.5 |
|
|
Mid-flood |
IS(Mf)16 |
Bottom |
6.0 |
5.9 |
|
IS(Mf)9 |
Bottom |
6.7 |
5.9 |
|
|
IS8 |
Bottom |
6.3 |
6.1 |
|
|
SR4/ SR4(N) |
Bottom |
6.2 |
6.2 |
|
|
SR4a |
Bottom |
5.2 |
5.7 |
Table 2.17 Summary of Annual Means of Depth-averaged Turbidity Level of Baseline Monitoring and Reporting Period (in NTU)
|
Station |
Station |
Annual mean of depth-averaged turbidity of baseline monitoring |
Annual mean of depth-averaged turbidity of reporting period |
|
Mid-ebb |
IS(Mf)16 |
8.9 |
6.1 |
|
IS(Mf)9 |
8.2 |
6.8 |
|
|
IS8 |
8.4 |
8.1 |
|
|
SR4/ SR4(N) |
8.9 |
7.6 |
|
|
SR4a |
8.9 |
8.1 |
|
|
Mid-flood |
IS(Mf)16 |
11.3 |
6.9 |
|
IS(Mf)9 |
10.2 |
8.3 |
|
|
IS8 |
11.9 |
9.0 |
|
|
SR4/ SR4(N) |
10.3 |
8.7 |
|
|
SR4a |
7.8 |
8.6 |
Table 2.18 Summary of Annual Means of Depth-averaged SS Level of Baseline Monitoring and Reporting Period (in mg/L)
|
Station |
Station |
Annual mean of depth-averaged SS of baseline monitoring |
Annual mean of depth-averaged SS of reporting period |
|
Mid-ebb |
IS(Mf)16 |
11.3 |
6.9 |
|
IS(Mf)9 |
10.9 |
7.0 |
|
|
IS8 |
11.3 |
7.9 |
|
|
SR4/ SR4(N) |
11.1 |
7.9 |
|
|
SR4a |
9.1 |
7.9 |
|
|
Mid-flood |
IS(Mf)16 |
10.4 |
7.6 |
|
IS(Mf)9 |
14.7 |
8.8 |
|
|
IS8 |
13.5 |
9.8 |
|
|
SR4/ SR4(N) |
12.2 |
9.7 |
|
|
SR4a |
9.8 |
9.9 |
Table 2.19 One-way ANOVA Results for DO Comparison between Impact and Baseline Periods
|
Tide |
Station |
Depth |
F ratio |
p-value |
|
Mid-ebb |
IS(Mf)16 |
Surface |
F 1,158 =2.9 |
0.089 |
|
Mid-ebb |
IS(Mf)9 |
Surface |
F 1,145 = 3.2 |
0.075 |
|
Mid-ebb |
IS8 |
Surface |
F 1,158 = 4.0 |
0.048 |
|
Mid-ebb |
SR4/SR4(N) |
Surface |
F 1,158 = 4.2 |
0.041 |
|
Mid-ebb |
SR4a |
Surface |
F 1,138 = 14.7 |
<0.001 |
|
Mid-flood |
IS(Mf)16 |
Surface |
F 1,147 = 4.8 |
0.030 |
|
Mid-flood |
IS(Mf)9 |
Surface |
F 1,99 = 1.0 |
0.327 |
|
Mid-flood |
IS8 |
Surface |
F 1,154 = 3.5 |
0.064 |
|
Mid-flood |
SR4/SR4(N) |
Surface |
F 1,156 =3.4 |
0.066 |
|
Mid-flood |
SR4a |
Surface |
F 1,157 = 15.2 |
<0.001 |
|
Mid-ebb |
IS(Mf)16 |
Middle |
F 1,18 = 3.3 |
0.085 |
|
Mid-flood Mid-flood |
IS(Mf)9 IS8 |
Middle Middle |
F 1,7 = 0.5 F 1,56 = 2.4 |
0.512 0.124 |
|
Mid-ebb |
IS(Mf)16 |
Bottom |
F 1,158 = 2.2 |
0.136 |
|
Mid-ebb |
IS(Mf)9 |
Bottom |
F 1,145 = 1.6 |
0.204 |
|
Mid-ebb |
IS8 |
Bottom |
F 1,158 = 2.5 |
0.117 |
|
Mid-ebb |
SR4/SR4(N) |
Bottom |
F 1,155 = 3.0 |
0.087 |
|
Mid-ebb |
SR4a |
Bottom |
F 1,158= 8.1 |
0.005 |
|
Mid-flood |
IS(Mf)16 |
Bottom |
F 1,157 = 5.1 |
0.025 |
|
Mid-flood |
IS(Mf)9 |
Bottom |
F 1,99 =0.2 |
0.694 |
|
Mid-flood |
IS8 |
Bottom |
F 1,154 = 3.1 |
0.078 |
|
Mid-flood |
SR4/SR4(N) |
Bottom |
F 1,154 =3.6 |
0.058 |
|
Mid-flood |
SR4a |
Bottom |
F 1,157 = 14.2 |
<0.001 |
Note:
By setting α at 0.05, p-values < 0.05 (significant difference) are bold.
Table 2.20 One-way ANOVA Results for Depth-averaged Turbidity Comparison between Impact and Baseline Periods
|
Tide |
Station |
F ratio |
p-value |
|
Mid-ebb Mid-ebb Mid-ebb Mid-ebb Mid-ebb |
IS(Mf)16 |
F 1,158 = 10.9 |
0.001 |
|
IS(Mf)9 |
F 1,158 = 1.9 |
0.171 |
|
|
IS8 |
F 1,158 = 0.7 |
0.797 |
|
|
SR4/SR4(N) |
F 1,158 = 1.8 |
0.182 |
|
|
SR4a |
F 1,158 = 0.4 |
0.524 |
|
|
Mid-flood |
IS(Mf)16 |
F 1,157 = 18.0 |
<0.001 |
|
Mid-flood |
IS(Mf)9 |
F 1,157 = 2.3 |
0.134 |
|
Mid-flood |
IS8 |
F 1,157 = 3.7 |
0.057 |
|
Mid-flood |
SR4/SR4(N) |
F 1,157 = 1.5 |
0.220 |
|
Mid-flood |
SR4a |
F 1,157 = 0.5 |
0.485 |
Note:
By setting α at 0.05, p-values < 0.05 (significant difference) are bold.
Table 2.21 One-way ANOVA Results for Depth-averaged SS Comparison between Impact and Baseline Periods
|
Tide |
Station |
F ratio |
p-value |
|
Mid-ebb |
IS(Mf)16 |
F 1,158 = 24.6 |
<0.001 |
|
Mid-ebb |
IS(Mf)9 |
F 1,158 = 21.1 |
<0.001 |
|
Mid-ebb |
IS8 |
F 1,158 = 7.9 |
0.006 |
|
Mid-ebb |
SR4/SR4(N) |
F 1,158 = 11.4 |
<0.001 |
|
Mid-ebb |
SR4a |
F 1,158 = 1.4 |
0.241 |
|
Mid-flood |
IS(Mf)16 |
F 1,157 = 9.1 |
0.003 |
|
Mid-flood |
IS(Mf)9 |
F 1,157 = 19.8 |
<0.001 |
|
Mid-flood |
IS8 |
F 1,157 = 5.2 |
0.024 |
|
Mid-flood |
SR4/SR4(N) |
F 1,157 = 3.6 |
0.058 |
|
Mid-flood |
SR4a |
F 1,157 = 0.01 |
0.924 |
|
Note: By setting α at 0.05, p-values < 0.05 (significant difference) are bold. |
|||
|
|
|||
In addition, linear regression was conducted to examine any significant relationship between DO / Turbidity / SS levels and time during this yearly monitoring period at each monitoring station. The method of data interpretation followed the same method as indicated in Section 2.1.4 for TSP monitoring. As shown in Tables 2.22 to 2.24, results of the regression analysis indicated that all DO levels did not have significant relationship with the time during this yearly monitoring period. Detailed investigation reports on exceedances were presented in Appendix N of Forty-ninth to Sixtieth Monthly EM&A Reports. The ET will keep track on the future water quality monitoring results during construction phase. Apart from DO level, there was no significant relationship between Turbidity / SS level and time during this yearly monitoring period. As such, it is considered that there is no apparent trend of increasing or decreasing Turbidity / SS levels in this reporting period.
Table 2.22 Linear Regression Result of DO
|
Parameter |
Station |
R2 |
F ratio |
p-value |
Intercept |
Coefficient of days of construction |
||
|
Mid-ebb Surface DO |
IS(Mf)16 |
0.249 |
48.6 |
<0.001 |
17.90 |
-0.007 |
|
|
|
IS(Mf)9 |
0.131 |
20.1 |
<0.001 |
15.54 |
-0.005 |
|
||
|
IS8 |
0.148 |
25.4 |
<0.001 |
15.77 |
-0.005 |
|
||
|
SR4 |
0.193 |
34.9 |
<0.001 |
16.30 |
-0.006 |
|
||
|
SR4a |
0.269 |
53.6 |
<0.001 |
17.12 |
-0.006 |
|
||
|
Mid-flood surface DO |
IS(Mf)16 |
0.120 |
19.7 |
<0.001 |
14.25 |
-0.004 |
|
|
|
IS(Mf)9 |
0.166 |
17.7 |
<0.001 |
16.01 |
-0.005 |
|
||
|
IS8 |
0.110 |
17.6 |
<0.001 |
14.17 |
-0.004 |
|
||
|
SR4 |
0.107 |
17.3 |
<0.001 |
13.68 |
-0.004 |
|
||
|
SR4a |
0.479 |
113.0 |
<0.001 |
13.48 |
-0.005 |
|
||
|
Mid-ebb middle DO |
IS(Mf)16 IS(Mf)9 |
0.050 0.449 |
0.6 9.0 |
0.046 0.012 |
9.82 18.9 |
-0.002 -0.007 |
|
|
|
Mid-flood middle DO |
IS(Mf)9 |
0.055 |
3.1 |
0.082 |
12.16 |
-0.003 |
|
|
|
Mid-ebb bottom DO |
IS(Mf)16 |
0.430 |
109.9 |
<0.001 |
20.90 |
-0.009 |
|
|
|
IS(Mf)9 |
0.206 |
34.5 |
<0.001 |
17.79 |
-0.006 |
|
||
|
IS8 |
0.248 |
48.2 |
<0.001 |
18.21 |
-0.007 |
|
||
|
SR4 |
0.248 |
48.1 |
<0.001 |
18.09 |
-0.007 |
|
||
|
SR4a |
0.402 |
98.3 |
<0.001 |
20.45 |
-0.009 |
|
||
|
Mid-flood bottom DO |
IS(Mf)16 |
0.285 |
57.9 |
<0.001 |
16.83 |
-0.006 |
|
|
|
IS(Mf)9 |
0.230 |
26.6 |
<0.001 |
17.11 |
-0.006 |
|
||
|
IS8 |
0.212 |
38.2 |
<0.001 |
15.81 |
-0.005 |
|
||
|
SR4 |
0.183 |
32.3 |
<0.001 |
15.05 |
-0.005 |
|
||
|
SR4a |
0.306 |
63.9 |
<0.001 |
17.98 |
-0.007 |
|
||
Note:
1. Dependent variable is set as DO (in mg/L) and independent variable is set as number of day of construction works.
2. R2 values of insignificant regression model are underlined.
Table 2.23 Linear Regression Result of Turbidity
|
Parameter |
Station |
R2 |
F ratio |
p-value |
Intercept |
Coefficient of days of construction |
|
Mid-ebb depth-averaged turbidity |
IS(Mf)16 |
0.001 |
0.1 |
0.728 |
4.85 |
0.001 |
|
IS(Mf)9 |
0.022 |
3.3 |
0.072 |
14.68 |
-0.005 |
|
|
IS8 |
0.055 |
8.5 |
0.004 |
23.84 |
-0.010 |
|
|
SR4 |
0.001 |
0.1 |
0.739 |
6.13 |
0.001 |
|
|
SR4a |
0.004 |
0.6 |
0.450 |
3.91 |
0.003 |
|
|
Mid-flood depth-averaged turbidity |
IS(Mf)16 |
<0.001 |
0.1 |
0.768 |
8.15 |
-0.001 |
|
IS(Mf)9 |
0.035 |
5.3 |
0.023 |
20.37 |
-0.007 |
|
|
IS8 |
0.023 |
3.4 |
0.067 |
20.64 |
-0.007 |
|
|
SR4 |
0.032 |
4.7 |
0.031 |
20.05 |
-0.007 |
|
|
SR4a |
<0.001 |
<0.001 |
0.995 |
8.60 |
<0.001 |
|
|
Note: 1. Dependent variable is set as turbidity (in NTU) and independent variable is set as number of day of construction works. 2. R2 values of insignificant regression model are underlined. |
||||||
Table 2.24 Linear Regression Result of SS
|
Parameter |
Station |
R2 |
F ratio |
p-value |
Intercept |
Coefficient of days of construction |
|
Mid-ebb depth-averaged SS |
IS(Mf)16 |
0.001 |
0.2 |
0.686 |
8.21 |
-0.001 |
|
IS(Mf)9 |
0.065 |
10.2 |
0.002 |
17.49 |
-0.006 |
|
|
IS8 |
0.078 |
12.3 |
0.001 |
24.35 |
-0.010 |
|
|
SR4 |
0.011 |
1.6 |
0.215 |
12.70 |
-0.003 |
|
|
SR4a |
0.064 |
9.9 |
0.002 |
19.97 |
-0.010 |
|
|
Mid-flood depth-averaged SS |
IS(Mf)16 |
0.016 |
2.4 |
0.129 |
13.56 |
-0.004 |
|
IS(Mf)9 |
0.146 |
24.7 |
<0.001 |
33.66 |
-0.015 |
|
|
IS8 |
0.112 |
18.2 |
<0.001 |
36.46 |
-0.016 |
|
|
SR4 |
0.030 |
4.5 |
0.036 |
21.28 |
-0.007 |
|
|
SR4a |
0.048 |
7.4 |
0.007 |
27.54 |
-0.011 |
Note:
1. Dependent variable is set as suspended solids (in mg/L) and independent variable is set as number of day of construction works.
2. R2 values of insignificant regression model are underlined.
2.4
Dolphin Monitoring
2.4.1
Monitoring Requirements
Impact dolphin monitoring is required to be conducted by a qualified dolphin specialist team to evaluate whether there have been any effects on the Indo-Pacific humpback dolphin Sousa chinensis (i.e. Chinese White Dolphin) from the Contract. In order to fulfil the EM&A requirements and make good use of available resources, the on-going impact line transect dolphin monitoring data collected by HyD’s Contract No. HY/2011/03 Hong Kong-Zhuhai-Macao Bridge. Hong Kong Link Road - Section between Scenic Hill and Hong Kong Boundary Crossing Facilities on monthly basis is adopted to avoid duplicates of survey effort.
2.4.2
Monitoring Equipment
Table 2.25 summarizes the equipment used for the impact dolphin monitoring.
Table 2.25 Dolphin Monitoring Equipment
|
Equipment |
Model |
|
Global Positioning System (GPS)
Camera
Laser Binoculars
Marine Binocular
Vessel for Monitoring
|
Garmin 18X-PC Geo One Phottix
Nikon D90 300m 2.8D fixed focus Nikon D90 20-300m zoom lens
Infinitor LRF 1000
Bushell 7 x 50 marine binocular with compass and reticules
65 foot single engine motor vessel with viewing platform 4.5m above water level |
2.4.3
Monitoring Parameter, Frequencies & Duration
The dolphin monitoring covered all transect lines in Northeast Lantau (NEL) and the Northwest Lantau (NWL) survey areas twice per month throughout the entire construction period. The monitoring data were compatible with, and should be made available for, long-term studies of small cetacean ecology in Hong Kong. In order to provide a suitable long-term dataset for comparison, identical methodology and line transects employed in baseline dolphin monitoring was followed in the impact dolphin monitoring.
2.4.4
Monitoring Location
The impact dolphin monitoring was carried out in the NEL and NWL along the line transect as depicted in Figure 2.4. The co-ordinates of all transect lines are shown in Table 2.26 ([5]) below.
Table 2.26 Impact Dolphin Monitoring Line Transect Co-ordinates
|
Line No. |
Easting |
Northing |
Line No. |
Easting |
Northing |
||
|
1 |
Start Point |
804671 |
815456 |
13 |
Start Point |
816506 |
819480 |
|
1 |
End Point |
804671 |
831404 |
13 |
End Point |
816506 |
824859 |
|
2 |
Start Point |
805476 |
820800 |
14 |
Start Point |
817537 |
820220 |
|
2 |
End Point |
805476 |
826654 |
14 |
End Point |
817537 |
824613 |
|
3 |
Start Point |
806464 |
821150 |
15 |
Start Point |
818568 |
820735 |
|
3 |
End Point |
806464 |
822911 |
15 |
End Point |
818568 |
824433 |
|
4 |
Start Point |
807518 |
821500 |
16 |
Start Point |
819532 |
821420 |
|
4 |
End Point |
807518 |
829230 |
16 |
End Point |
819532 |
824209 |
|
5 |
Start Point |
808504 |
821850 |
17 |
Start Point |
820451 |
822125 |
|
5 |
End Point |
808504 |
828602 |
17 |
End Point |
820451 |
823671 |
|
6 |
Start Point |
809490 |
822150 |
18 |
Start Point |
821504 |
822371 |
|
6 |
End Point |
809490 |
825352 |
18 |
End Point |
821504 |
823761 |
|
7 |
Start Point |
810499 |
822000* |
19 |
Start Point |
822513 |
823268 |
|
7 |
End Point |
810499 |
824613 |
19 |
End Point |
822513 |
824321 |
|
8 |
Start Point |
811508 |
821123 |
20 |
Start Point |
823477 |
823402 |
|
8 |
End Point |
811508 |
824254 |
20 |
End Point |
823477 |
824613 |
|
9 |
Start Point |
812516 |
821303 |
21 |
Start Point |
805476 |
827081 |
|
9 |
End Point |
812516 |
824254 |
21 |
End Point |
805476 |
830562 |
|
10 |
Start Point |
813525 |
821176 |
22 |
Start Point |
806464 |
824033 |
|
10 |
End Point |
813525 |
824657 |
22 |
End Point |
806464 |
829598 |
|
11 |
Start Point |
814556 |
818853 |
23 |
Start Point |
814559 |
821739 |
|
11 |
End Point |
814556 |
820992 |
23 |
End Point |
814559 |
824768 |
|
12 |
Start Point |
815542 |
818807 |
24 |
Start Point |
805476 |
815900 |
|
12 |
End Point |
815542 |
824882 |
24 |
End Point |
805476 |
819100 |
2.4.5
Action & Limit Levels
The Action and Limit levels of dolphin impact monitoring are shown in Appendix C. The Event Action Plan is presented in Appendix H.
2.4.6
Monitoring Schedule for the Reporting Period
The dolphin monitoring schedules for the reporting period are provided in the Forty-ninth to sixtieth Monthly EM&A Reports.
2.4.7
Results & Observations
A total of 3,152.08 km of survey effort was collected, with 93.6% of the total survey effort being conducted under favourable weather conditions (i.e. Beaufort Sea State 3 or below with good visibility). Among the two areas, 1,160.48 km and 1,991.60 km of survey effort were conducted in NEL and NWL survey areas, respectively. The total survey effort conducted on primary lines was 2,300.78 km while the effort on secondary lines was 851.30 km. Both survey efforts conducted on primary and secondary lines were considered as on-effort survey data. The survey efforts are summarized in Appendix G.
During the twenty-four sets of monitoring surveys from November 2017 to October 2018, a total of 42 groups of 131 Chinese White Dolphins (CWDs) were sighted. In this 12-month period, all except two (2) dolphin sightings were made during on-effort search. Thirty-three (33) out of 40 on-effort dolphin sightings were made on primary lines, while seven (7) groups of dolphins were sighted on secondary lines. All sightings were made in NWL region. No sighting was made in the proximity of the Project’s alignment. Summary table of the dolphin sightings is shown in Appendix II of Appendix G.
During the present 12-month impact phase monitoring period, the average daily encounter rates of Chinese White Dolphins were deduced in NEL and NWL survey areas, and compared to the ones deduced from the baseline, transitional and first three year of impact phases as shown in Table 2.27.
Table 2.27 Average Dolphin Encounter Rates
|
|
Encounter rate (STG) (no. of on-effort dolphin sightings per 100 km of survey effort) |
Encounter rate (ANI) (no. of dolphins from all on-effort sightings per 100 km of survey effort) |
||
|
Northeast Lantau |
Northwest Lantau |
Northeast Lantau |
Northwest Lantau |
|
|
Impact Phase (2017-18, this reporting period) |
0.00 |
2.68 ± 3.04 |
0.00 |
9.02 ± 14.63 |
|
Impact Phase (2016-17) |
0.00 |
2.35 ± 2.62 |
0.00 |
8.57 ± 11.05 |
|
Impact Phase (2015-16) |
0.00 |
2.10 ± 1.83 |
0.00 |
8.54 ± 8.53 |
|
Impact Phase (2014-15) |
0.11 ± 0.54 |
2.54 ± 2.49 |
0.11 ± 0.54 |
11.64 ± 14.04 |
|
Impact Phase (2013-14) |
0.22 ± 0.74 |
6.93 ± 4.08 |
0.76 ± 2.59 |
26.31 ± 17.56 |
|
Transitional Phase (2012-13) |
1.70 ± 2.26 |
7.68 ± 4.36 |
4.75 ± 7.61 |
27.51 ± 18.06 |
|
Baseline Phase (2011-12) |
6.05 ± 5.04 |
7.75 ± 5.69 |
19.91 ± 21.30 |
29.57 ± 26.96 |
Comparison of average daily dolphin encounter rates from this impact phase (November 2017 – October 2018), the first four years of impact phases (November 2013 – October 2017), transitional phase (November 2012 – October 2013) and baseline phase monitoring periods (February 2011 – January 2012). (± denotes the standard deviation of the value)
Group size of Chinese White Dolphins ranged from 1-12 individuals per group in North Lantau region during November 2017 - October 2018. The average dolphin group sizes from the 12-month impact phase monitoring period were compared with the ones deduced from baseline and transitional and first four years of impact phases, as shown in Table 2.28.
Table 2.28 Comparison of Average Dolphin Group Size
|
|
Average Dolphin Group Size |
||
|
Overall |
Northeast Lantau |
Northwest Lantau |
|
|
Impact Phase (2017-18, this reporting period) |
3.12 ± 2.86 (n = 42) |
0.00 |
3.12 ± 2.86 (n = 42) |
|
Impact Phase (2016-17) |
3.51 ± 2.68 (n = 43) |
0.00 |
3.51 ± 2.68 (n = 43) |
|
Impact Phase (2015-16) |
3.73 ± 3.14 (n = 45) |
1.00 (n = 1) |
3.80 ± 3.14 (n = 44) |
|
Impact Phase (2014-15) |
4.24 ± 3.15 (n = 54) |
1.00 (n = 1) |
4.30 ± 3.15 (n = 53) |
|
Impact Phase (2013-14) |
3.76 ± 2.57 (n = 136) |
5.00 ± 2.71 (n = 4) |
3.73 ± 2.57 (n = 132) |
|
Transitional Phase (2012-13) |
3.37 ± 2.98 (n = 186) |
2.64 ± 2.38 (n = 22) |
3.47 ± 3.05 (n = 164) |
|
Baseline Phase (2011-12) |
3.32 ± 2.86 (n = 288) |
2.80 ± 2.35 (n = 79) |
3.52 ± 3.01 (n = 209) |
Comparison of average dolphin group size from this impact phase (November 2017– October 2018, the first four years of impact phases (November 2013 – October 2017), transitional phase (November 2012 – October 2013) and baseline phase monitoring periods (February 2011 – January 2012). (± denotes the standard deviation of the value)
Two (2) Action Level and three (3) Limit Level exceedances for both NEL and NWL regions were recorded for four (4) sets of quarterly dolphin monitoring data between November 2017 and October 2018. In this reporting period, no unacceptable impact from the activities of this Contract on Chinese White Dolphins was noticeable from general observations. It is essential to continue monitoring the dolphin usage in North Lantau region for the rest of the impact phase monitoring period. Photo IDs of sighted dolphin are presented in Appendix K of the Forty-eighth to sixtieth Monthly EM&A Report.
2.4.8
Marine Mammal Exclusion Zone Monitoring
Daily marine mammal exclusion zone monitoring was undertaken during the period of marine works under this Contract. No sighting of Chinese White Dolphin was recorded in the monitoring period during the exclusion zone monitoring.
Passive Acoustic Monitoring (PAM) was not undertaken in this reporting period as no marine piling works was carried out outside the daylight hours since September 2015. Daytime marine mammal exclusion zone was still in effect to cater for temporary staging installation and uninstallation works.
2.5
EM&A Site Inspection
Site inspections were carried out on weekly basis to monitor the implementation of proper environmental pollution control and mitigation measures under the Contract. Fifty-one (51) site inspections were carried out in the reporting period. Key observations were summarized in the section of EM&A Site Inspection in the Forty-ninth to sixtieth Monthly EM&A Reports. The Contractor has rectified all of the observations identified during environmental site inspections in the reporting period.
2.6
Waste Management Status
The Contractor had submitted application form for registration as chemical waste producer under the Contract. Sufficient numbers of receptacles were available for general refuse collection and sorting.
Wastes generated during this reporting period include mainly construction wastes (inert and non-inert), recyclable materials and chemical waste. Reference has been made to the waste flow table prepared by the Contractor (Appendix I). The quantities of different types of wastes are summarized in Table 2.29.
Table 2.29 Quantities of Different Waste Generated in the Reporting Period
|
Month/ Year |
Inert Construction Waste (a) (m3) |
Imported Fill (m3) |
Inert Construction Waste Re-used (m3) |
Non-inert Construction Waste (b) (tonnes) |
Recyclable Materials (c) (kg) |
Chemical Wastes (kg) |
Marine Sediment (m3) |
|||
|
Category L |
Category M (Mp & Mf) |
Category H |
||||||||
|
November 2017 |
3,354 |
0 |
23 |
159,650 |
5,868 |
5,400 |
0 |
0 |
0 |
|
|
December 2017 |
3,054 |
0 |
164 |
181,710 |
15,636 |
2,400 |
0 |
0 |
0 |
|
|
January 2018 |
4,288 |
0 |
137 |
211,060 |
84 |
0 |
0 |
0 |
0 |
|
|
February 2018 |
2,662 |
0 |
826 |
184,880 |
28 |
0 |
0 |
0 |
0 |
|
|
March 2018 |
5,916 |
1,877 |
2,503 |
307,670 |
30,351 |
1,200 |
0 |
0 |
0 |
|
|
April 2018 |
6,103 |
3,977 |
852 |
349,640 |
19,262 |
0 |
0 |
0 |
0 |
|
|
May 2018 |
4,492 |
1,336 |
1,481 |
438,160 |
56 |
0 |
0 |
0 |
0 |
|
|
June 2018 |
2,801 |
67 |
1,134 |
669,690 |
9,605 |
0 |
0 |
0 |
0 |
|
|
July 2018 |
1,361 |
181 |
208 |
639,210 |
13,316 |
0 |
0 |
0 |
0 |
|
|
August 2018 |
2,369 |
1,455 |
189 |
508,670 |
0 |
1,200 |
0 |
0 |
0 |
|
|
September 2018 |
1,866 |
0 |
0 |
419,480 |
4,986 |
4,000 |
0 |
0 |
0 |
|
|
October 2018 |
3,182 |
0 |
0 |
365,740 |
56 |
4,800 |
0 |
0 |
0 |
|
|
Total |
41,448 |
8,893 |
7,517 |
4,435,560 |
99,248 |
19,000 |
0 |
0 |
0 |
|
|
Notes: |
||||||||||
|
(a) Inert construction wastes include hard rock and large broken concrete, and materials disposed as public fill. (b) Non-inert construction wastes include general refuse disposed at landfill. (c) Recyclable materials include metals, paper, cardboard, plastics, timber and others. |
||||||||||
The Contractor was advised to properly maintain on site C&D materials and waste collection, sorting and recording system, dispose of C&D materials and wastes at designated ground and maximize reuse/ recycle of C&D materials and wastes. The Contractor was also reminded to properly maintain the site tidiness and dispose of the wastes accumulated on site regularly and properly.
For chemical waste containers, the Contractor was reminded to treat properly and store temporarily in designated chemical waste storage area on site in accordance with the Code of Practice on the Packaging, Labelling and Storage of Chemical Wastes.
2.7
Environmental Licenses and Permits
The status of environmental licensing and permit is summarized in Table 2.30 below.
Table 2.30 Summary of Environmental Licensing and Permit Status
|
License/ Permit |
License or Permit No. |
Date of Issue |
Date of Expiry |
License/ Permit Holder |
Remarks |
|
Environmental Permit |
EP-353/2009/K |
11-Apr-16 |
N/A |
HyD |
Hong Kong Boundary Crossing Facilities |
|
Environmental Permit |
EP-354/2009/D |
13-Mar-15 |
N/A |
HyD |
Tuen Mun- Chek Lap Kok Link |
|
Chemical Waste Registration |
5213-951-G2380-17 |
12-Jun-14 |
N/A |
GCL |
Viaducts A, B, C, D & E |
|
Chemical Waste Registration |
5213-961-G2380-13 |
10-Oct-13 |
N/A |
GCL |
Chemical waste produced in Contract HY/2012/07 (Area 1 adjacent to Cheng Tung Road, Siu Ho Wan) |
|
Chemical Waste Registration |
5213-961-G2380-14 |
10-Oct-13 |
N/A |
GCL |
Chemical waste produced in Contract HY/2012/07 (Area 2 adjacent to Cheung Tung Road, Pak Mong Village) |
|
Chemical Waste Registration |
5213-974-G2588-03 |
04-Nov-13 |
N/A |
GCL |
Chemical waste produced in Contract HY/2012/07 (WA5 adjacent to Cheung Tung Road, Yam O) |
|
Construction Dust Notification |
361571 |
05-Jul-13 |
N/A |
GCL |
|
|
Construction Dust Notification |
362093 |
17-Jul-13 |
N/A |
GCL |
For Area 23 |
|
Construction Waste Disposal Account |
7017735 |
10-Jul-13 |
N/A |
GCL |
- |
|
Construction Waste Disposal Account |
7019470 |
03-Mar-14 |
Vessel CHIT Account |
GCL |
Vessel CHIT Account |
|
Waste Water Discharge License |
WT00019017-2014 |
13 May 2014 |
31 May 2019 |
GCL |
Discharge for marine portion |
|
Waste Water Discharge License |
WT00019018-2014 |
13 May 2014 |
31 May 2019 |
GCL |
Discharge for land portion |
|
Construction Noise Permit for night works and works in general holidays |
GW-RW0294-17 |
19 Jun 2017 |
18 Dec 2017 |
GCL |
General works at WA5
|
|
Construction Noise Permit for night works and works in general holidays |
GW-RW0650-17 |
19-Dec-17 |
18-Jun-18 |
GCL |
General works at WA5 |
|
Construction Noise Permit for night works and works in general holidays |
GW-RW0235-18
|
21 Jun 2018 |
18 Dec 2018 |
GCL |
General works at WA5 |
|
Construction Noise Permit for night works and works in general holidays |
GW-RS0540-17
|
20 Jun 2017 |
15 Dec 2017 |
GCL |
Broad Permit for Whole Site Areas
|
|
Construction Noise Permit for night works and works in general holidays |
GW-RS1112-17
|
14-Dec-17 |
31-Mar-18 |
GCL |
Broad Permit for Whole Site Areas |
|
Construction Noise Permit for night works and works in general holidays |
GW-RS0244-18
|
30-Mar-18 |
29-Sep-18 |
GCL |
Broad Permit for Whole Site Areas |
|
Construction Noise Permit for night works and works in general holidays |
GW-RS0740-18
|
20 Aug-18 |
16 Feb-19 |
GCL |
Broad Permit for Whole Site Areas
|
|
Construction Noise Permit for night works and works in general holidays |
GW-RS1025-17 |
30-Nov-17 |
31-Dec-17 |
GCL |
Broad Permit for Segment Launching at Land Portion |
|
Construction Noise Permit for night works and works in general holidays |
GW-RS1153-17 |
31-Dec-17 |
31-Mar-18 |
GCL |
Broad Permit for Segment Launching at Land Portion |
|
Construction Noise Permit for night works and works in general holidays |
GW-RS0201-18 |
12-Mar-18 |
30-Apr-18 |
GCL |
Broad Permit for Segment Launching at Land Portion |
|
Construction Noise Permit for night works and works in general holidays |
GW-RS0328-18
|
30-Apr-18 |
29-Jun-18 |
GCL |
Broad Permit for Segment Launching at Land Portion |
|
Construction Noise Permit for night works and works in general holidays |
GW-RS0426-18
|
11 Jun 2018 |
31 Jul 2018 |
GCL |
Broad Permit for Segment Launching at Land Portion |
|
Construction Noise Permit for night works and works in general holidays |
GW-RS0654-18
|
1 Aug 2018 |
30 Sep 2018 |
GCL |
Broad Permit for Segment Launching at Land Portion |
|
Construction Noise Permit for night works and works in general holidays Construction Noise Permit for night works and works in general holidays Construction Noise Permit for night works and works in general holidays |
GW-RS0829-17
GW-RS0668-17
GW-RS0954-17 |
29 Sep 2017 7 Aug 2017 5 Nov 2017 |
30 Nov 2017 6 Feb 2018 30 Nov 2017 |
GCL GCL GCL |
Broad Permit for Segment Launching at Land Portion Pre-casted pile cap shell installation at E8-E13
Contingency plan for DN800T works at Tung Chung Seafront Road |
|
Construction Noise Permit for night works and works in general holidays |
GW-RS0064-18 |
1-Feb-18 |
29-Jul-18 |
GCL |
Pre-casted pile cap shell installation at E8-E13 |
|
Construction Noise Permit for night works and works in general holidays |
GW-RS0411-18 |
26-May-18 |
31-May-18 |
GCL |
Street Lamp Replacement at East Coast Road |
|
Construction Noise Permit for night works and works in general holidays |
GW-RS0657-18 |
1 Aug 2018 |
31 Oct 2018 |
GCL |
Cover Traffic Sign at Tung Chung |
|
Construction Noise Permit for night works and works in general holidays |
GW-RS0658-18 |
1 Aug 2018 |
22 Aug 2018 |
GCL |
East Coast Road Street Light Repairing |
|
Construction Noise Permit for night works and works in general holidays |
GW-RS0752-18 |
28 Aug 2018 |
31 Oct 2018 |
GCL |
Traffic Light Installation |
|
Construction Noise Permit for night works and works in general holidays |
GW-RS0909-18 |
16 Oct 2018 |
30 Nov 2018 |
GCL |
Road milling and paving at Airport Road |
|
Construction Noise Permit for night works and works in general holidays |
GW-RS0911-18 |
12 Oct 2018 |
30 Oct 2018 |
GCL |
Broad Permit for Segment Launching at Land Portion |
|
Marine Dumping Permit |
EP/MD/18-031 |
1 Jul 2017 |
31 Dec 2017 |
GCL |
For dumping Type I sediment |
2.8
Implementation Status of
Environmental Mitigation Measures
A summary of the Environmental Mitigation and Enhancement Measure Implementation Schedules (EMIS) is presented in Appendix B. The necessary mitigation measures were implemented properly for this Contract.
2.9
Summary of Exceedances of the Environmental Quality
Performance Limit
One (1) Limit Level of 1-hour TSP was recorded for air quality monitoring in the reporting period and no exceedance in 24-hour TSP for air quality monitoring and construction noise in the reporting period.
In this reporting period, a total of 150 monitoring events were undertaken. Eighty –six (86) Action Level and eight (8) Limit Level of Dissolved Oxygen (DO) exceedances, nine (9) Action Level and one (1) Limit Level of Suspended Solids (SS) exceedance and one (1) Action Level of Turbidity exceedance were recorded for water quality impact monitoring in the reporting period. Actions were taken in accordance with the Event Action Plan as presented in Appendix H.
Two (2) Action Level and three (3) Limit Level exceedances for both NEL and NWL regions were recorded for impact dolphin monitoring for both NEL and NWL regions. No unacceptable impact from the construction activities of the TM-CLKL Southern Connection Viaduct Section on Chinese White Dolphins was noticeable from general observations during the dolphin monitoring in this reporting period. Detailed investigation reports were presented in Appendix L of Sixteen to Nineteen Quarterly EM&A Reports.
2.10
Summary of Complaints, Notification of Summons and
Successful Prosecutions
The Environmental Complaint Handling Procedure is provided in Figure 2.5.
There were four (4) complaints received in the reporting period. Complaints included construction dust nuisance at Hong Kong Boundary Crossing (HKBCF) of Hong Kong-Zhuhai-Macau Bridge Projects, a suspected sighting of dolphin near the viaduct at Tai Ho Wan and construction materials failing from the nearby elevated structures on 29 January 2018, discharge of muddy water nearby HKBCF on 13 June 2018 and construction noise nuisance nearby the Kowloon-boundary lane of the North Lantau Highway on 16 June 2018. Upon investigation, there were no adequate evidences to conclude that the complaint cases were related to this Contract. The detailed investigation reports were presented in the Appendix N of the Forty--ninth to sixtieth Monthly EM&A Report.
No notification of summons or successful prosecution was received in the reporting period.
Statistics on complaints, notifications of summons, successful prosecutions are summarized in Appendix J.
3
Comparison of EM&A Results with
EIA Predictions and Baseline Monitoring Results
The EM&A results in the reporting period are compared to the predictions from EIA Report and baseline monitoring result in order to review the validity of EIA predictions.
3.1
Air Quality Monitoring
Air quality monitoring for this Contract was undertaken during the baseline and impact monitoring periods. As identified in the TM-CLKL EIA Report, key construction activities of this Contract include excavation works, road works, slope works and foundation works. Comparison of EM&A results with EIA predictions is presented in Table 3.1. Maximum 1-hour TSP level in this yearly impact monitoring was comparable to the baseline range, in which most of the impact and baseline TSP levels were higher than the levels predicted in the EIA Report. The average 1-hour TSP and 24-hour TSP levels measured in this yearly impact monitoring were lower than the corresponding TSP levels measured in the baseline monitoring at all stations and thus suggested that no noticeable deterioration of air quality was caused by the construction activities of this Contract during the impact monitoring period.
Table 3.1 Comparison of Impacts on Air Quality (in μg/m³) between EIA Prediction and Impact Monitoring Period
|
Monitoring Station |
EIA Predicted Maximum |
Maximum Baseline Monitoring |
Maximum Impact Monitoring |
Average Baseline Monitoring |
Average Impact Monitoring |
|
|
ASR9 (1-hour TSP) |
205 (1) /240 |
462 |
680 |
220 |
90 |
|
|
ASR9 (24-hour TSP) |
83 (1) / 108 |
113 |
172 |
74 |
59 |
|
|
ASR8A (1-hour TSP) |
293 / 205 (1) |
464 |
346 |
222 |
80 |
|
|
ASR8A (24-hour TSP) |
105 /83 (1) |
128 |
151 |
74 |
57 |
|
|
Note: 1. EIA prediction of maximum of ASR8 is presented for reference. 2. Scenario 1 of EIA prediction is adopted, in which north and south reclamations of TMCLKL were included in the modelling. 3. EIA predictions and baseline monitoring results of ASR9A and ASR9C are applied to ASR8A and ASR9 respectively. |
|
|||||
3.2
Noise Impact Monitoring
Noise impact monitoring for this Contract was undertaken during the baseline and impact monitoring periods. Major noise sources of this Contract during the reporting period included construction activities, nearby traffic noise and aircraft noise. Construction Noise Permits (CNP), as recommended in the EIA Report, were applied and complied with when Power Mechanical Equipment (PME) was deployed for construction works during restricted hours. The EIA assessment has predicted that marginal impacts would be expected at the Pak Mong Village during construction phase. Comparison of EM&A results with EIA predictions is presented in Table 3.2. In general, the average impact noise monitoring results recorded in the reporting period were within the range of the predicted noise levels in the EIA Report and thus suggested that no unacceptable level of construction noise generated from the Contract during the impact monitoring period.
Table 3.2 Comparison of Impacts on Noise (in dB (A)) between EIA Prediction and Impact Monitoring Period
|
Monitoring Station |
EIA Predicted Maximum |
Maximum Impact Monitoring |
Average Baseline Monitoring |
Average Impact Monitoring |
|
NSR1 |
74 |
70 |
57 |
61 |
|
Note: 1. EIA maximum noise level was predicted in SPL. Baseline and impact monitoring were measured in Leq,30min. |
||||
3.3
Water Quality Monitoring
Water quality monitoring for this Contract was undertaken during the baseline and impact monitoring periods. Major construction activities of this Contract in the reporting period included uninstallation of marine piling platform. According to EIA prediction, no SS exceedance is anticipated from this Project at the water sensitive receivers nearby the Contract works area (WSR 22a, WSR 22b and WSR 22c). The average baseline and impact monitoring results are presented in Table 3.3. It is noted that most of the annual-averaged SS levels recorded in the reporting period were comparable to or lower than the baseline monitoring results, except for SR4a during mid- mid-flood tide in which annual-averaged SS levels were slightly higher than the corresponding average baseline levels. Although one (1) Limit Level of exceedance on depth-averaged SS were recorded in the reporting period, the exceedances were considered not related to this Contract upon further investigation. Thus, the impact monitoring results are considered influenced by fluctuation of background regional water quality and no unacceptable impacts on marine water was observed caused by this Project.
Table 3.3 Comparison of Depth-averaged SS (in mg/L) between Baseline and Impact Monitoring Period
|
Monitoring Station |
Tide |
Baseline monitoring |
Impact Monitoring of this Reporting Period |
|
CS(Mf)3/ CS(Mf)3(N) |
Mid-ebb |
8.8 |
7.9 |
|
CS(Mf)5 |
9.2 |
6.5 |
|
|
IS(Mf)16 |
11.3 |
6.9 |
|
|
IS(Mf)9 |
10.9 |
7.0 |
|
|
IS8 |
11.3 |
7.9 |
|
|
SR4/SR4(N) |
11.1 |
7.9 |
|
|
SR4a |
9.1 |
7.9 |
|
|
CS(Mf)3/ CS(Mf)3(N) |
Mid-flood |
12.4 |
9.6 |
|
CS(Mf)5 |
11.5 |
6.5 |
|
|
IS(Mf)16 |
10.4 |
7.6 |
|
|
IS(Mf)9 |
14.7 |
8.8 |
|
|
IS8 |
13.5 |
9.8 |
|
|
SR4/SR4(N) |
12.2 |
9.7 |
|
|
SR4a |
9.8 |
9.9 |
3.4
Marine Ecology
According to the baseline results in the Appendix F of the approved EIA Report, the dolphin groups were largely sighted near waters around Lung Kwu Chau and Sha Chau. There was no dolphin sighted along the alignment of this Contract. Two-way ANOVAs with repeated measures were conducted to compare results of average encounter rate of sightings (STG) and average encounter rate of dolphins (ANI) between baseline, transitional and impact periods. Although the STG and ANI in impact monitoring period were lower than that before the commencement of this Contract (see Section 2.4.7) and the differences between the six periods are statistically significant (see Section 3.3.4 of Appendix G), the distribution pattern was still similar between the impact monitoring periods and before the commencement (i.e. transition period in 2012 – 2013) of this Contract. Dolphins were observed mainly around Lung Kwu Chau and less frequently in the North Lantau region where the works area of this Contract is situated. The monitoring results in this reporting period are considered to be in line with the EIA predictions, and the review of monitoring data suggested that no unacceptable impacts was noted from the marine works under this Contract. It is essential to monitor the dolphin usage in North Lantau region for the rest of impact monitoring period to keep track on the trend of dolphin ranging pattern.
3.5
Waste Management
In general, wastes generated from the construction activities including C&D materials (inert and non-inert), chemical wastes, marine sediment and recyclable materials. The summary of waste generation amount is presented in Table 2.30.
Waste monitoring and audit programme has been undertaken during this reporting period. Wastes arising from this Project have been managed in accordance with the recommendations in the EIA Report, the EM&A Manual, the Waste Management Plan and other relevant statutory requirements.
The requirements for construction waste management have been reviewed and were considered as adequate. No change to the requirements was considered to be necessary.
3.6
Summary of Monitoring Methodology and Effectiveness
The EM&A monitoring programme has been reviewed and was considered effective and adequate to cater for the nature of works in progress. No further change to the monitoring programme was considered to be necessary.
The EM&A programme will be evaluated as appropriate in the next reporting period and improvements in the EM&A programme will be recommended if deemed necessary.
3.7
Summary of Mitigation Measures
The mitigation measures stipulated in the Updated EM&A Manual were undertaken by the Contractor in the reporting period. The mitigation measures were reviewed and considered effective. No addition or change on mitigation measures was considered to be necessary.
4
Future Key Issues
4.1
Key Issues for the coming period
Potential environmental impacts arising from the upcoming construction activities are mainly associated with air quality, noise, marine water quality, marine ecology and waste management issues.
5
Conclusion and Recommendations
This Fifth Annual EM&A Report presents findings of the EM&A activities undertaken during the period from 1 November 2017 to 31 October 2018, in accordance with the Updated EM&A Manual and the requirements of the Environmental Permits (EP-354/2009/D and EP-353/2009/K).
Eighty-six (86) Action Level and eight (8) Limit Level of Dissolved Oxygen (DO) exceedances, nine (9) Action Level and one (1) Limit Level of Suspended Solids (SS) exceedance and one (1) Action Level of Turbidity exceedance were recorded for water quality impact monitoring in the reporting period.
One (1) Limit Level of 1-hour TSP was recorded for air quality monitoring in the reporting period. There were no Action nor Limit Level exceedances observed for 24-hour TSP air quality monitoring in the reporting period.
There were no Action Level nor Limit Level exceedances were observed for noise monitoring in this reporting period.
A total of 42 groups of 131 Chinese White Dolphins (CWDs) were sighted. Two (2) Action Level and three (3) Limit Level exceedances for both NEL and NWL regions were recorded for four (4) sets of quarterly dolphin monitoring data between November 2017 and October 2018, whilst no unacceptable impact from the activities of this Contract on Chinese White Dolphins was noticeable from the general observations. It is essential to continue monitoring the dolphin usage in North Lantau region for the rest of the impact phase monitoring period.
Environmental site inspection was carried out fifty-one (51) times in the reporting period. Recommendations on remedial actions were given to the Contractor for the deficiencies identified during the site audits.
There were four (4) complaints received from EPD / 1823 in the reporting period. Complaints included construction dust nuisance at Hong Kong Boundary Crossing (HKBCF) of Hong Kong-Zhuhai-Macau Bridge Projects, a suspected sighting of dolphin near the viaduct at Tai Ho Wan and construction materials failing from the nearby elevated structures on 29 January 2018, discharge of muddy water nearby HKBCF on 13 June 2018 and construction noise nuisance nearby the Kowloon-boundary lane of the North Lantau Highway on 16 June 2018. Upon investigation, there were no adequate evidences to conclude that the complaint cases were related to this Contract.
No summons/ prosecution were received during the reporting period.
The review of monitoring data suggested that the construction works under this Contract have proceeded in an environmentally acceptable manner in this reporting period. In general, the monitoring results were in line with EIA predictions.
The monitoring programme has been reviewed and was considered as adequate to cater for the nature of works in progress. Change to the monitoring programme was thus not recommended at this stage. The monitoring programme will be evaluated as appropriate in the next reporting period. The ET will keep track on the construction works to confirm compliance of environmental requirements and the proper implementation of all necessary mitigation measures.
([1]) Agreement No. CE 35/2011 (EP) Baseline Environmental Monitoring for Hong Kong - Zhuhai - Macao Bridge Hong Kong Projects - Investigation. Baseline Environmental Monitoring Report (Version C). Submitted on 8 March 2012 and subsequently approved by EPD
([2]) Agreement No. CE 35/2011 (EP) Baseline Environmental Monitoring for Hong Kong - Zhuhai - Macao Bridge Hong Kong Projects - Investigation. Baseline Environmental Monitoring Report (Version C). Submitted on 8 March 2012 and subsequently approved by EPD
([3]) Agreement No. CE 35/2011 (EP) Baseline Environmental Monitoring for Hong Kong - Zhuhai - Macao Bridge Hong Kong Projects - Investigation. Baseline Environmental Monitoring Report (Version C). Submitted on 8 March 2012 and subsequently approved by EPD.
([4]) The schedules for water quality monitoring for the period between June and July 2017 could be referred to the published Monthly EM&A Reports of Contract No. HY/2010/02 Hong Kong-Zhuhai-Macao Bridge Hong Kong Boundary Crossing Facilities – Reclamation Works. Available at http://www.hzmbenpo.com/